
What is Datadog?
Datadog is a commercial software-as-a-service platform for monitoring and security from Datadog, Inc. It brings infrastructure metrics, application performance monitoring (APM), log management, real user monitoring, synthetic tests, security products, incident management and AI features together in one web application. Data is collected mainly by the Datadog Agent running on hosts and containers, by language tracing libraries, by OpenTelemetry and by more than 1,000 built-in integrations with cloud services and software, as listed in the integrations catalog.
The company states on its contact page that it is headquartered in New York City, with a European headquarters in Paris and offices in North America, Latin America, Europe and Asia-Pacific. Its leadership page names Olivier Pomel as CEO and co-founder and Alexis Lê-Quôc as CTO and co-founder.
Datadog itself is not self-hosted: customers choose one of the regional sites, US1, US3, US5, EU1 (Germany), AP1 (Japan), AP2 (Australia) and the US1-FED and US2-FED government sites, described in the site documentation. Some products are not available on the US-FED site, as the pricing page notes per product. The web application is complemented by a mobile app for iOS and Android with dashboards, alerts, incidents and on-call management.
The Datadog Agent is open source under the Apache 2.0 license and runs on Linux distributions, Windows, macOS and AIX, in Docker and Kubernetes (with a separate Cluster Agent), on Amazon ECS, Heroku and Cloud Foundry, and alongside serverless functions. The Agent is released frequently; version 7.85.3 was published on November 10, 2026. A standalone DogStatsD package exists for containerized setups, and the Agent ships a local Agent Manager GUI on port 5002 on Windows and macOS.
Pricing is published per product on the pricing page, mostly per host, per volume of data or per event, with annual, monthly and on-demand rates and multi-year or volume discounts. The platform has a REST API documented in the API reference, and the product menu also lists an MCP server, IDE plugins, the Pup CLI, a Marketplace and Datadog Apps for extending the platform.
Key capabilities
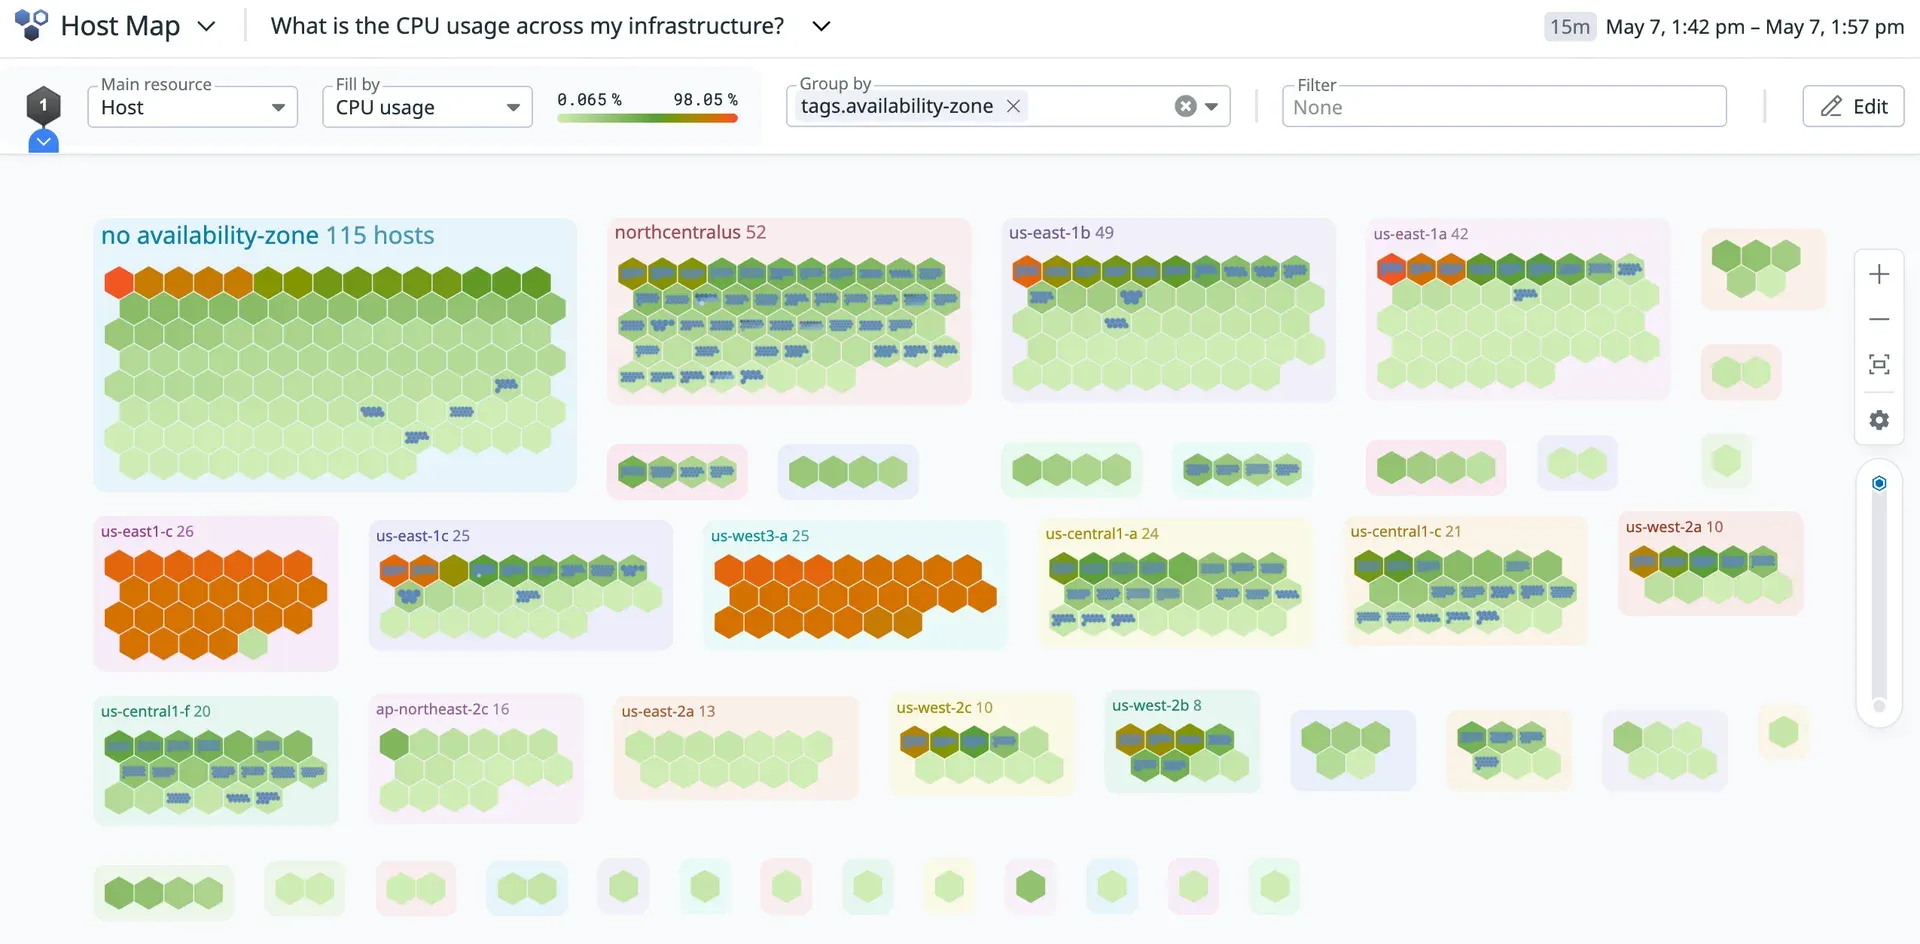
- Infrastructure Monitoring Hosts, containers and cloud resources report system and custom metrics into a time-series store with 15 months of full-resolution retention. The Host Map shows hosts as hexagons that can be filled by a metric such as CPU usage and grouped by tags like availability zone.
- Infrastructure plans Pro starts at $15 per host per month billed annually ($18 on demand) and includes 1,000+ integrations, container monitoring with 5 containers per host, 100 custom metrics per host and OpenTelemetry support. Enterprise starts at $23 per host per month ($27 on demand) with 10 containers and 200 custom metrics per host, machine-learning-based alerts, Live Processes and the Governance Console. Basic hosts for noncritical workloads are priced through sales.
- Container billing Containers beyond the per-host allotment cost $0.002 per container per hour, or can be prepaid at $1 per container per month ($1.50 for DevSecOps containers), according to the pricing FAQ. Custom events beyond the allotment cost $2 per 100,000 billed annually.
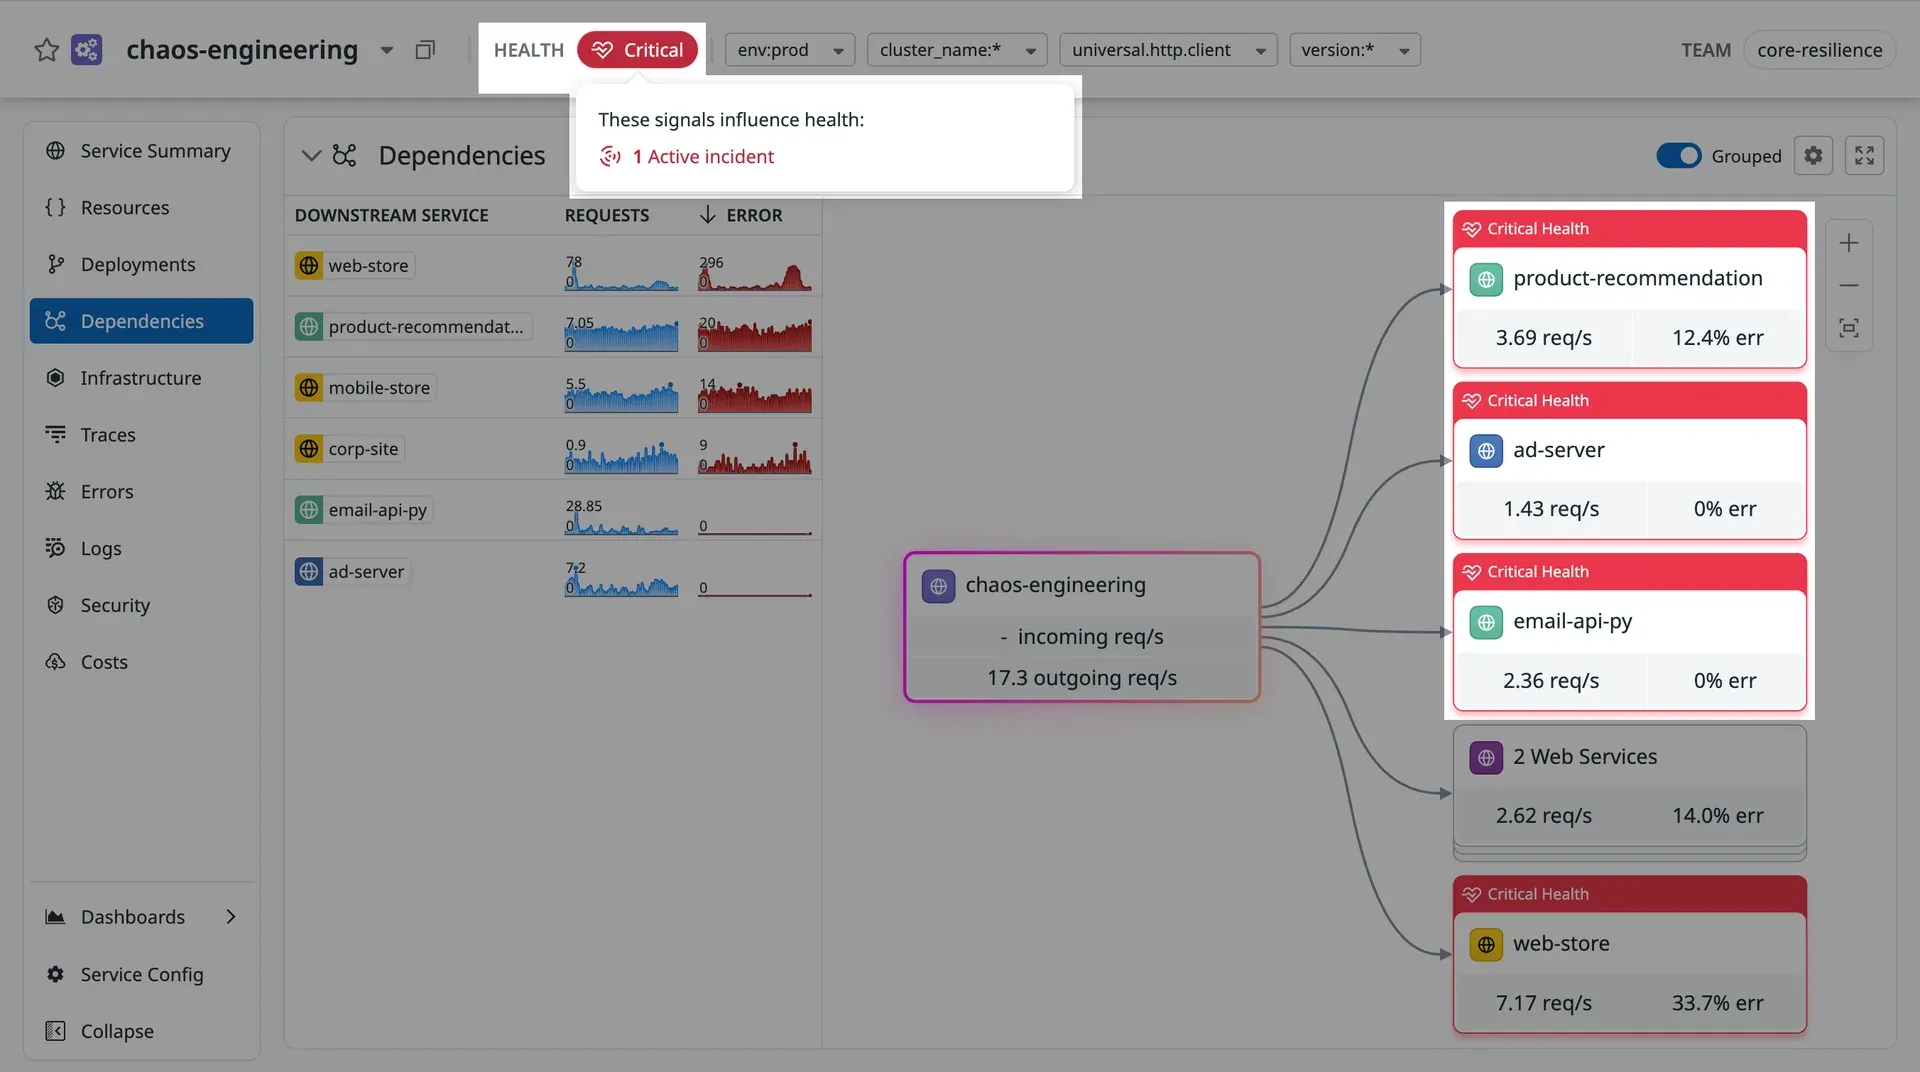
- Application Performance Monitoring Distributed tracing follows requests across services, and the service page shows a service's health, dependencies with request and error rates, deployments, infrastructure, traces, errors, logs, security signals and costs. The product menu also lists Universal Service Monitoring, the Continuous Profiler and Dynamic Instrumentation.
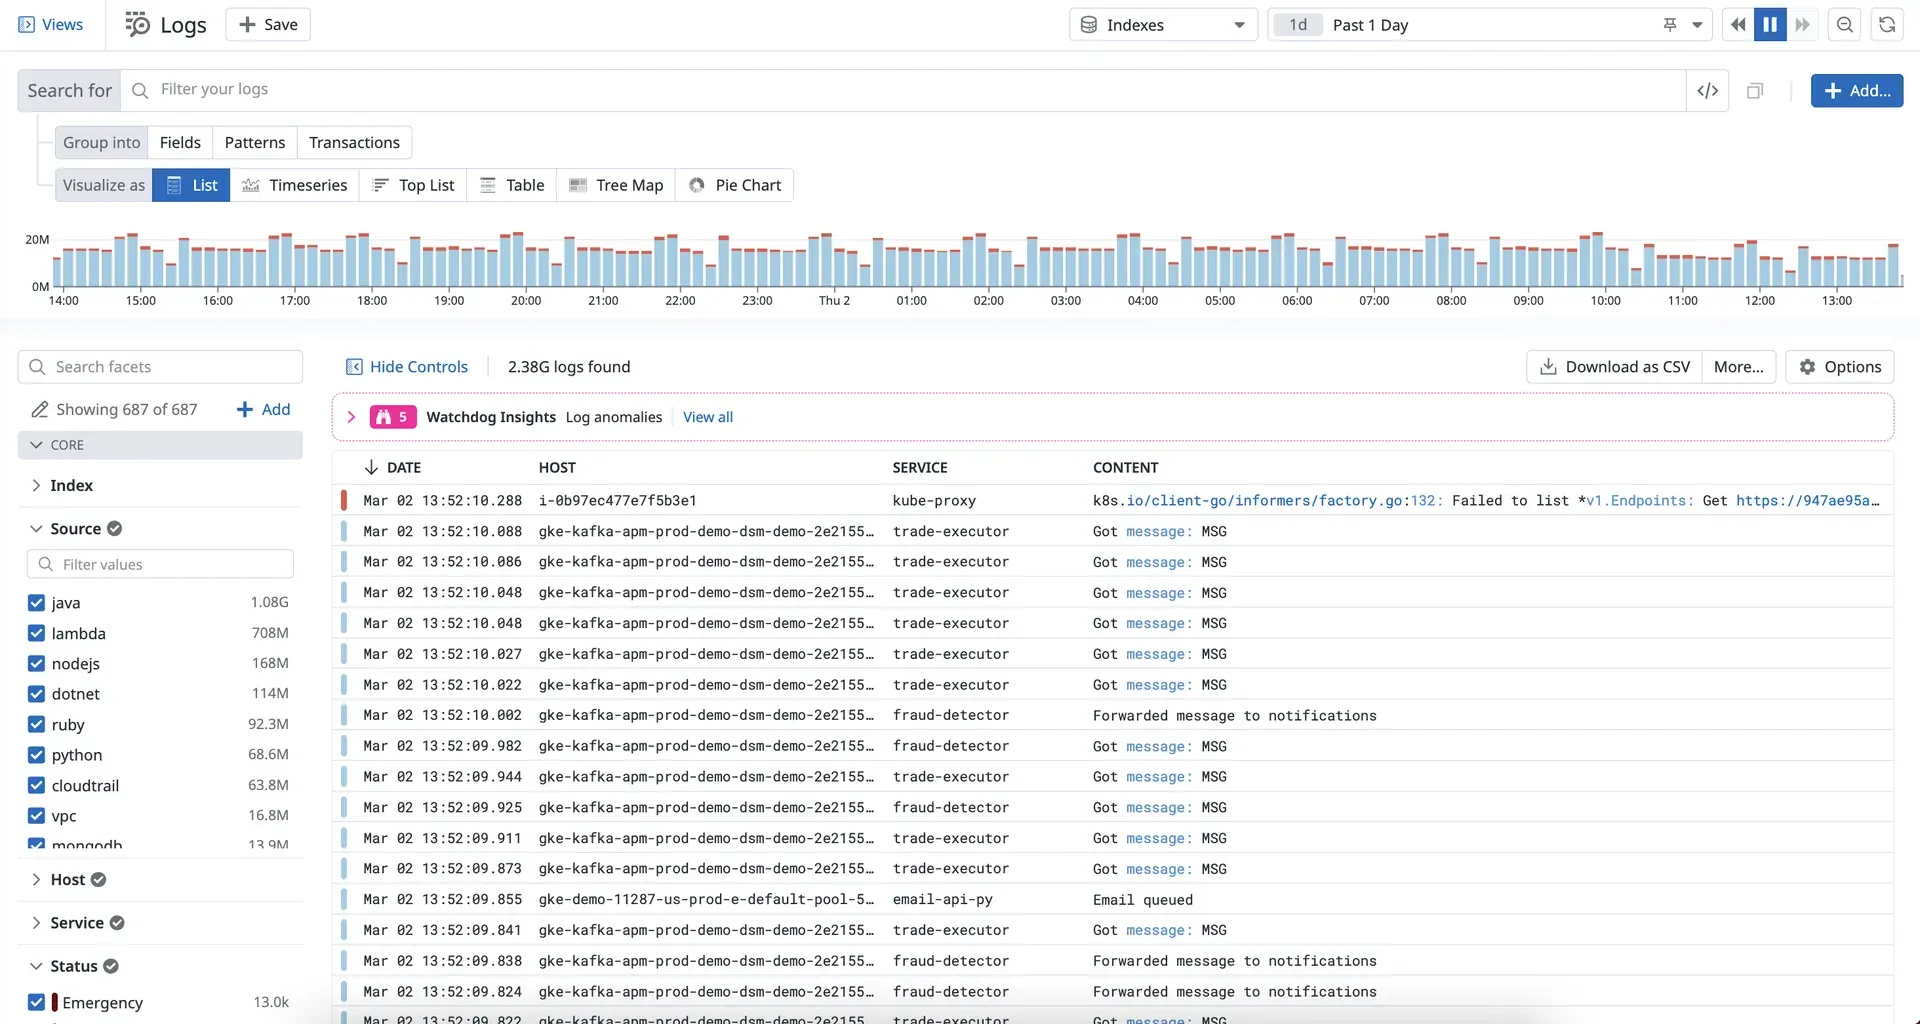
- Log Management Logs are ingested and processed at a starting price of $0.10 per GB, and Standard Indexing for frequently searched logs starts at $1.70 per million log events per month with 15-day retention ($2.55 on demand); other retention periods from 3 to more than 30 days are offered. The Log Explorer groups logs into fields, patterns or transactions and visualizes them as lists, timeseries, top lists, tables, tree maps or pie charts.
- Flex Logs and archives Flex Storage keeps infrequently accessed logs from $0.05 per million events stored per month with 1 to 15 months of retention, and Flex Logs Starter starts at $0.60 per million events with 3 to 15 months of retention. Forwarding to S3, Google Cloud Storage or Azure Storage archives is included in ingest, rehydration costs $0.10 per compressed GB scanned, and forwarding to other destinations starts at $0.25 per GB.
- Security products Cloud Security covers posture management for clouds and Kubernetes, entitlement management, vulnerability management for hosts and containers and workload protection. Code Security includes software composition analysis, static and runtime code analysis, IaC security and secret scanning, and Cloud SIEM, App and API Protection and the Sensitive Data Scanner round out the security menu. DevSecOps Pro starts at $22 and DevSecOps Enterprise at $34 per host per month billed annually.
- Digital experience Real User Monitoring, Session Replay, Product Analytics, Experiments, Synthetic Monitoring for browser and API tests, Mobile App Testing and Error Tracking cover front-end and mobile applications.
- Software delivery CI Visibility, Test Optimization, Code Coverage (from $8 per committer per month billed annually), DORA metrics, an Internal Developer Portal with a Software Catalog and Feature Flags are offered. Feature Flags are free below 1 million monthly flag configuration requests and cost $55 per million between 1 and 10 million on annual billing.
- Service management Incident Management, On-Call, Service Level Objectives, Event Management, Workflow Automation, Datadog Apps and Work Management connect alerts to response processes. Monitors support anomaly detection, outlier detection, forecasts and Watchdog automated insights on Pro and Enterprise plans.
- AI features Bits AI covers investigation, chat, code fixes, a security analyst and an agent builder, billed through AI credits from $500 per 500 credits per month or $1.30 per credit on demand. For AI applications, Datadog lists Agent Observability, AI Guard and GPU Monitoring.
- Dashboards and notebooks Dashboards combine widgets on a grid, and Notebooks are listed among the built-in platform features. Out-of-the-box dashboards come with integrations, and the dashboard documentation covers creating and sharing them.
- Datadog Agent and integrations The open-source Agent collects host metrics, logs and traces and runs integration checks; it is installed per platform or through configuration-management tools such as Ansible, Chef, Puppet, SaltStack and SCCM. Disk space for a full installation is about 830 to 880 MB on Linux and 870 MB on Windows, per the Agent documentation.
- Access control and governance All infrastructure plans include unlimited user accounts and SAML single sign-on. Enterprise adds SCIM, multiple SAML providers, IP and email-domain allowlists and the Governance Console, and Data Access Control covers 10 datasets on Pro and 100 on Enterprise, with cross-org visibility for 5 or 100 connections.
- API and extensibility A documented REST API gives programmatic access to the platform, and DogStatsD in the Agent accepts custom metrics and events from application code. The product menu lists an MCP server, IDE plugins, the Pup CLI, an Agent Directory and a Marketplace for partner integrations.
Where Datadog fits
Monitoring cloud and on-premises infrastructure
The Agent is installed on hosts, in Docker or in Kubernetes, and cloud integrations pull metrics from AWS, Azure, Google Cloud and other providers. Host Maps, out-of-the-box dashboards and monitors with anomaly or forecast alerts show resource use across availability zones and services.
Tracing application requests
Tracing libraries or OpenTelemetry send spans to APM, where each service has a page with request rates, error rates, latency, dependencies, deployments and linked logs. Teams follow a slow or failing request from the front end through downstream services to the database query or host involved.
Centralizing and searching logs
Logs from the Agent, cloud services and forwarders are ingested, processed and either indexed for search with a chosen retention or kept in Flex Logs or archives. The Log Explorer filters by facets such as source, host, service and status and correlates log lines with traces and metrics.
Securing cloud workloads and code
Cloud Security posture checks map resources to compliance frameworks, vulnerability management scans hosts and containers, and Code Security analyzes dependencies and source code. Cloud SIEM correlates security signals from logs, as described on the pricing page sections for these products.
Responding to incidents
Monitors trigger alerts that route to On-Call schedules and the mobile app, Incident Management tracks response and timelines, and Workflow Automation runs remediation steps. SLOs track reliability targets over time.
Monitoring user experience and releases
RUM, Session Replay and Synthetic tests measure front-end performance from real users and scripted checks, while CI Visibility, Test Optimization and DORA metrics cover the delivery pipeline. Similar platforms listed on iThub include New Relic, Dynatrace and Grafana.
Reviews of Datadog
Be the first to share your experience with Datadog.
Write a review
Loading review form…
Found Datadog useful? Upvote it todayYour vote helps other IT teams find it in the daily ranking.