
What is New Relic?
New Relic is a hosted observability platform made by New Relic, Inc. The company was founded in 2008 and its official fact sheet lists its address at 188 Spear St., San Francisco. On November 8, 2023, New Relic announced that Francisco Partners and TPG completed their acquisition of the company for $87.00 per share, an equity valuation of about $6.5 billion; its common stock stopped trading on the New York Stock Exchange and New Relic became a private company.
The platform stores metrics, events, logs and traces in one data layer and queries them with NRQL, the New Relic Query Language. Data arrives from New Relic APM agents for Go, Java, .NET, Node.js, PHP, Python and Ruby, the infrastructure agent, browser and mobile agents, cloud integrations, ingest APIs and OpenTelemetry over OTLP. The product catalog groups these sources into application performance monitoring, infrastructure and Kubernetes monitoring, log management, digital experience monitoring (browser, mobile and synthetic checks), serverless monitoring, AI monitoring, alerts and dashboards.
New Relic is delivered as a service in the browser at one.newrelic.com, with companion mobile apps for iOS and Android. An organization is created in one of three data center regions: the United States (the default), the European Union or Japan, according to the data center documentation. Moving existing customer data between regions is not supported, and a few features, such as APM weekly performance reports, are unavailable outside the US region.
Pricing on the official pricing page is usage-based. The Free edition includes 100 GB of data ingest per month, one full platform user and unlimited basic users. Standard, Pro and Enterprise editions charge for data beyond 100 GB ($0.40 per GB for the original data option, $0.60 per GB for Data Plus) and for core and full platform users, or for compute capacity units under the compute model. Hosts, agents and containers are not counted.
On June 23, 2026, New Relic announced New Relic Autopilot and New Relic Ground Truth. Autopilot is described as an automated SRE agent operated by New Relic that triages incidents, identifies likely root causes and scopes remediations; Ground Truth gives external AI agents API access to New Relic observability data. The platform is closed-source software operated by New Relic and is not available for self-hosting. Similar services listed on iThub include Datadog and Dynatrace.
Key capabilities
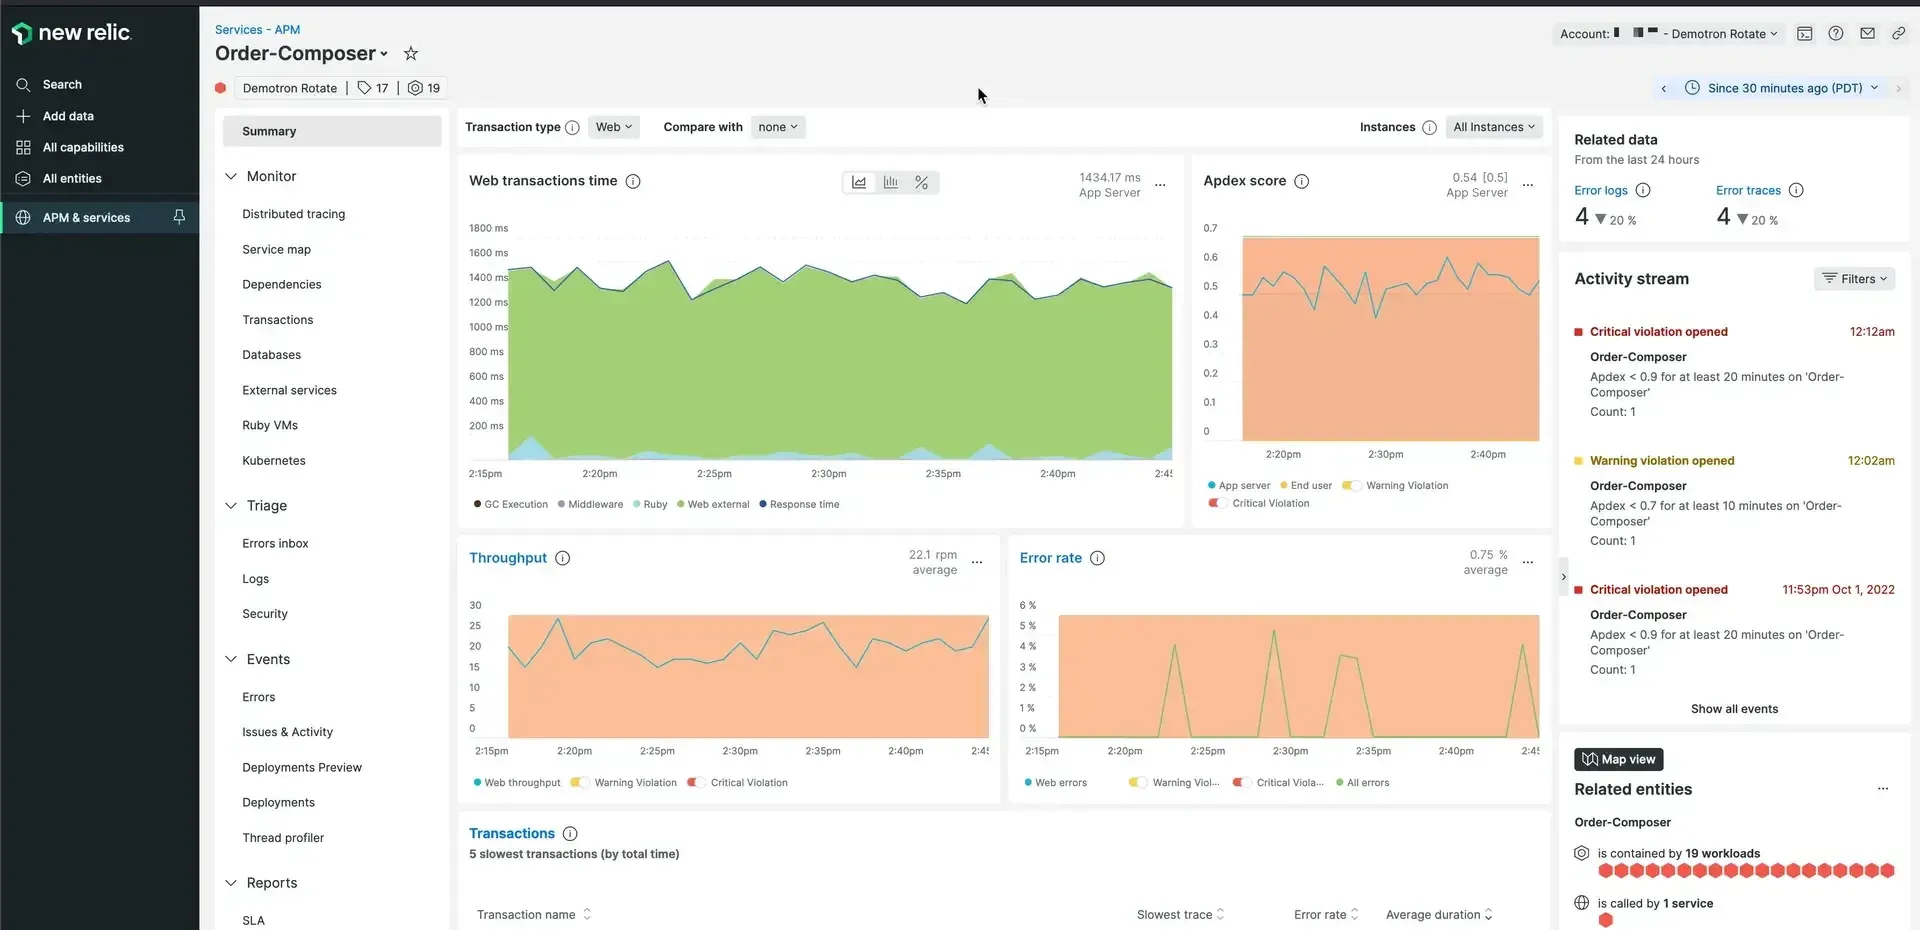
- Application performance monitoring APM agents are available for Go, Java, .NET, Node.js, PHP, Python and Ruby. The APM summary shows response time, throughput, error rate, Apdex score, slow transactions, database queries and external service calls, with transaction traces and stack traces for errors. The APM introduction states an agent overhead of under 3 percent.
- Distributed tracing Traces follow requests across services instrumented with New Relic agents or OpenTelemetry. Infinite Tracing has its own OTLP endpoint. Traces link to the APM entities, logs and errors that belong to the same request.
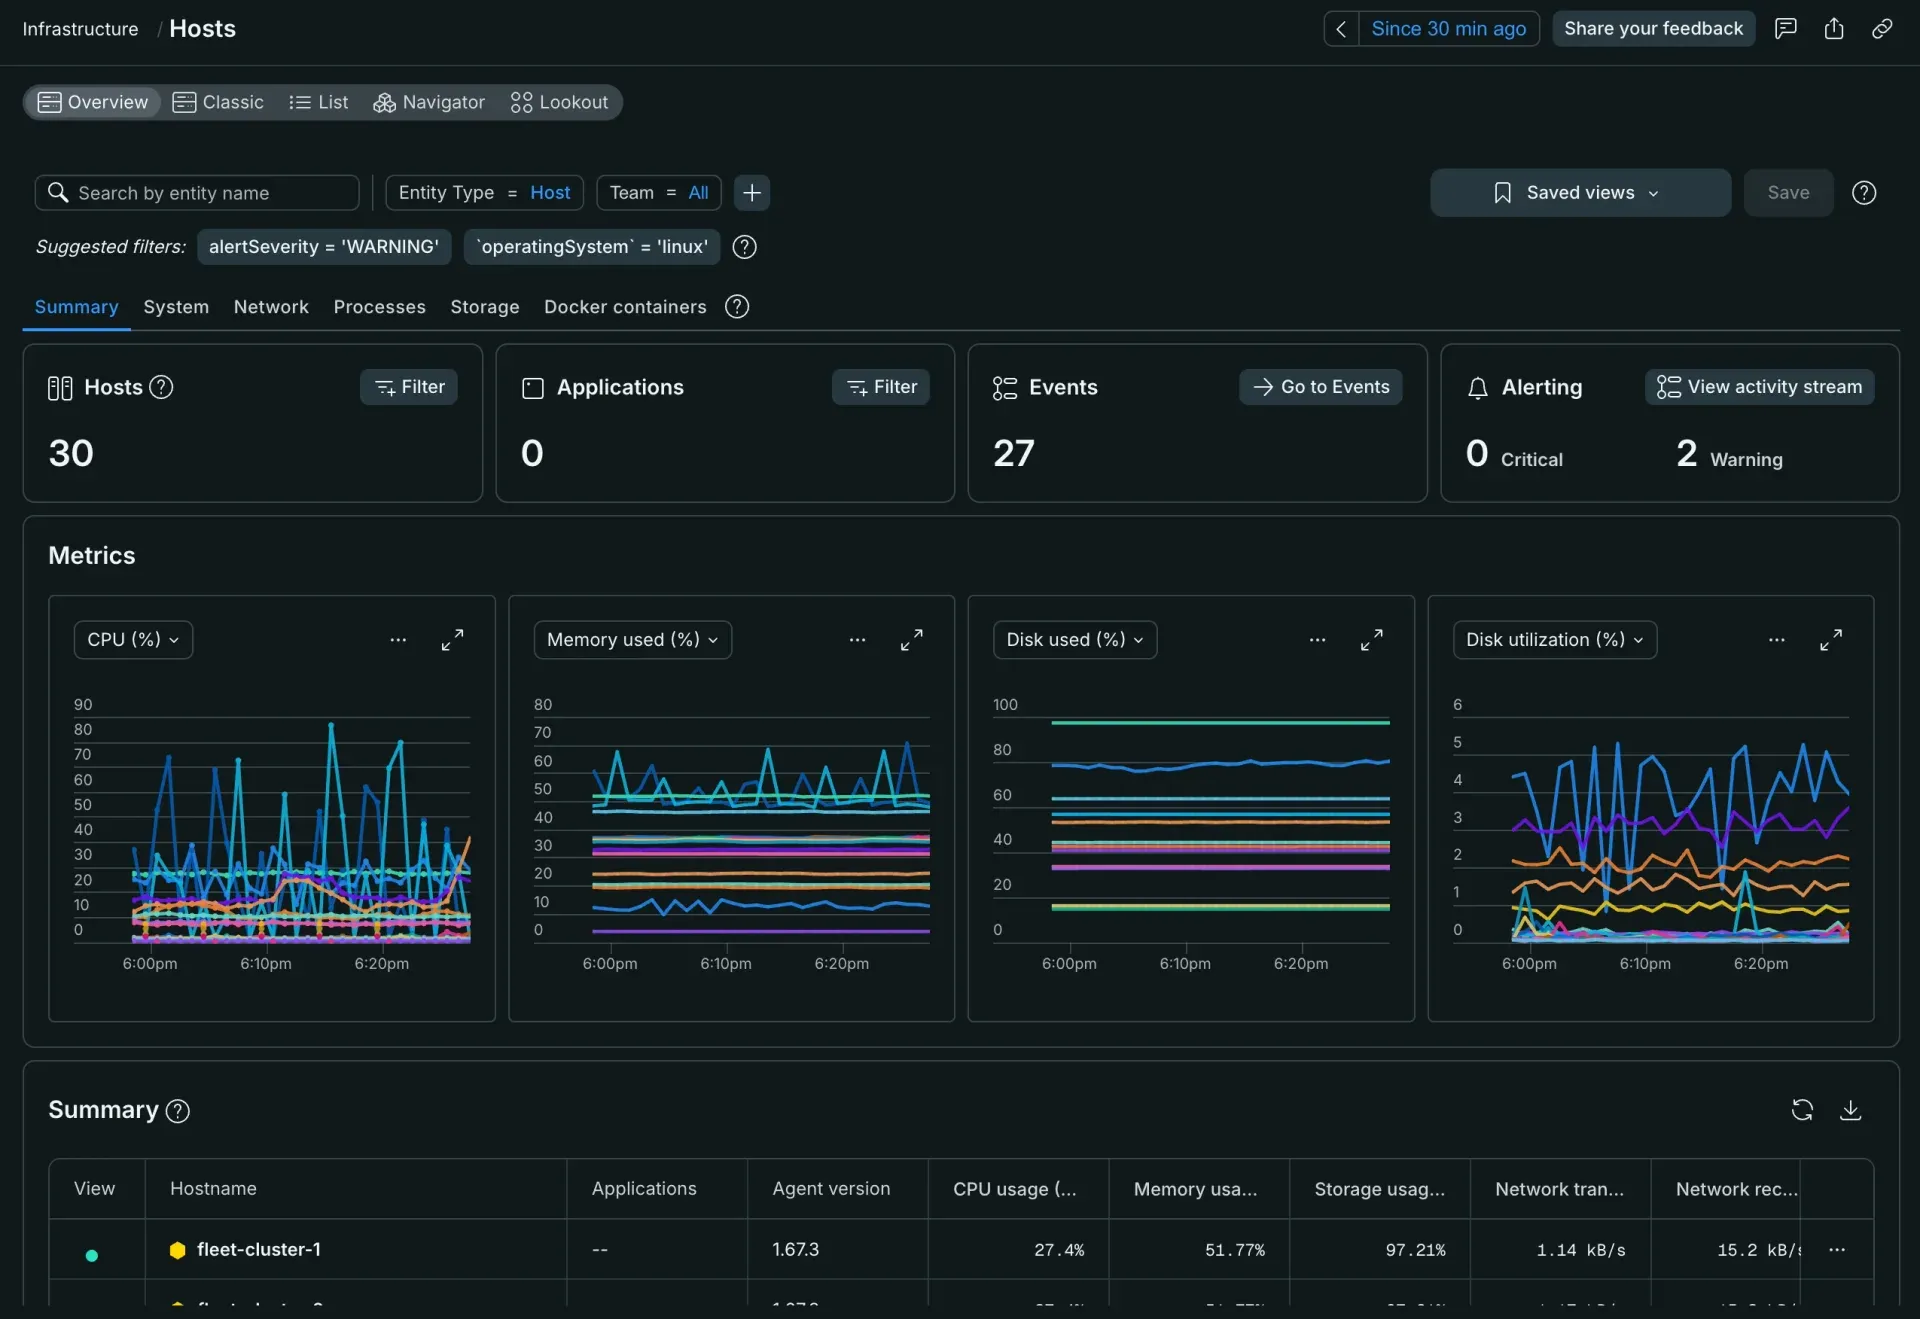
- Infrastructure monitoring The infrastructure agent reports host metrics, processes, storage, network and inventory. Documented operating systems include Amazon Linux 2 and 2023, RHEL 7.9 to 10, Debian 11 to 13, Ubuntu LTS 16.04 to 24.04, SLES 12.5 and 15.x, AlmaLinux and Rocky Linux 8 to 10, Windows Server 2016 to 2025, Windows 10 and 11, and the three most recent macOS versions.
- Kubernetes and container monitoring The Kubernetes integration reports clusters, nodes, pods and containers, with a cluster explorer and a Kubernetes navigator view. ECS clusters use a separate integration, and Amazon Bottlerocket workloads are covered through the containerized agent or the Kubernetes integration on EKS.
- Cloud integrations The product catalog lists AWS, Azure and Google Cloud monitoring. Cloud integrations bring provider service data into the platform, and log forwarders for AWS Firehose and AWS Lambda send cloud logs into the platform.
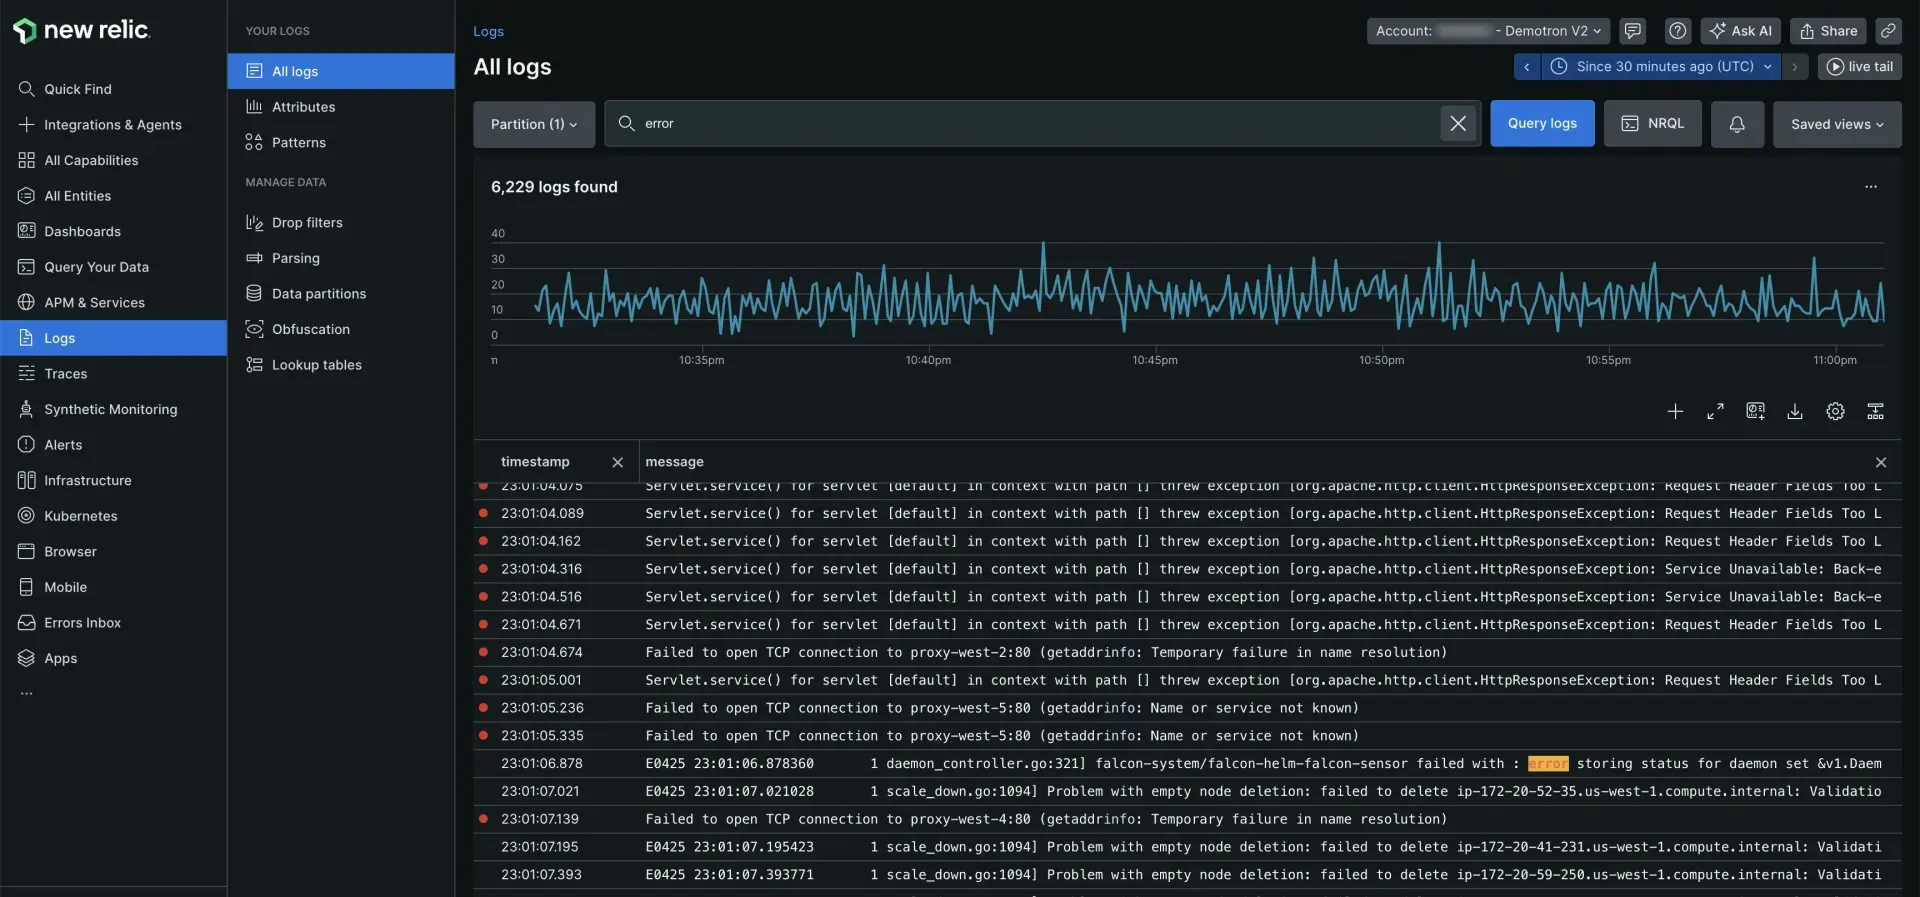
- Log management Logs arrive from APM agents, the infrastructure agent, Fluentd, Fluent Bit, Logstash, Kubernetes, Amazon and Microsoft integrations, the Log API, a TCP endpoint or OpenTelemetry. Logs are stored as the Log data type, queried with NRQL and shown in a UI with live tail, patterns, parsing rules, drop filters, data partitions and obfuscation. Logs in context links log lines to errors, traces and hosts.
- Browser monitoring and session replay The browser agent measures page loads, JavaScript errors, AJAX requests and Core Web Vitals in real user sessions. Session replay is listed under digital experience monitoring, and source maps can be uploaded through a dedicated API.
- Mobile monitoring Mobile agents cover Android, iOS, Capacitor, Cordova, Flutter, .NET MAUI, React Native, Unity and Unreal Engine. The mobile UI shows crashes with stack traces and interaction trails, handled exceptions, HTTP request analysis and crash trends by device, operating system and carrier, as described in the mobile monitoring introduction.
- Synthetic monitoring Monitor types include simple browser monitors for single page loads, step monitors built from 12 prebuilt steps and scripted browser monitors for multi-step user flows. Monitors run from public locations or from private locations operated by the customer. The Free edition includes 500 synthetic checks per month.
- AI monitoring When enabled in an APM agent, AI monitoring records metric and event data from external LLMs and vector stores, token counts for prompts and completions, request and response content and end-user feedback. The documentation names models from OpenAI, Amazon Bedrock and DeepSeek among the supported vendors.
- OpenTelemetry ingest New Relic accepts OTLP over gRPC and HTTP at otlp.nr-data.net (US), otlp.eu01.nr-data.net (EU) and otlp.jp.nr-data.net (JP) on ports 443, 4317 and 4318, plus a FedRAMP endpoint. TLS is required. The OTLP endpoint guide lists the protocol details and limits.
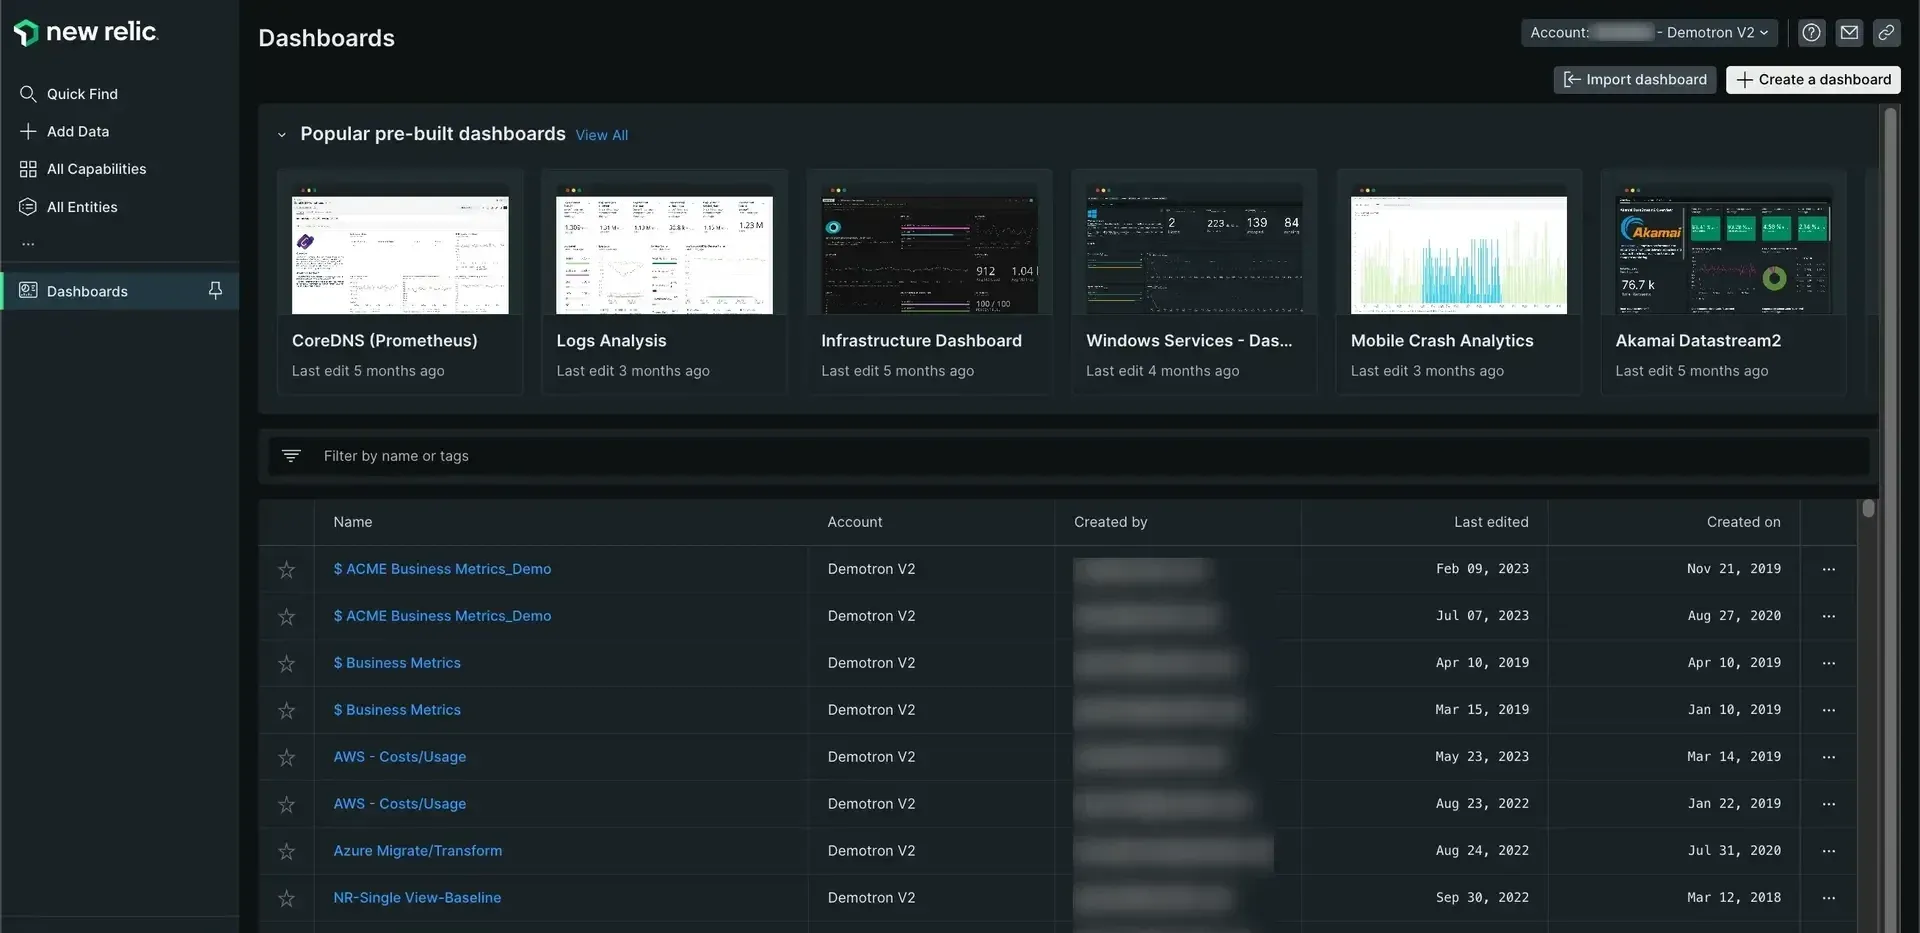
- NRQL, dashboards and charts All telemetry is queryable with NRQL. Dashboards combine NRQL charts, can be imported or duplicated, and a catalog of pre-built dashboards exists for common integrations. Basic users can view custom dashboards and alerts at no charge.
- Alerts and workflows Alert conditions apply thresholds or anomaly detection to a signal; policies group conditions, related alert events are correlated into issues, and workflows decide when and where notifications are sent. Notifications go to configured destinations when an issue opens, is acknowledged or closes. Predictive alerts are in public preview.
- Errors inbox and change tracking Errors from APM, browser and mobile agents are grouped in a triage inbox. Change tracking records deployments, feature flag toggles and configuration updates on a timeline so performance before and after a change can be compared.
- New Relic Autopilot and Ground Truth Autopilot, announced in June 2026, is an AI operations assistant that investigates incidents, proposes likely root causes and recommends next steps, with specialists for Kubernetes and Kafka and connections to Jira and GitHub through MCP. Ground Truth exposes New Relic data to customers' own AI agents through APIs.
- APIs NerdGraph is the GraphQL API at api.newrelic.com/graphql (EU and JP variants exist) for querying data and configuring features such as tags, workloads, dashboards and alerts; it uses a user API key. Separate ingest APIs accept metrics, events, logs and traces. The NerdGraph introduction lists the available tutorials.
- Editions and user types Free, Standard, Pro and Enterprise editions exist; Standard is limited to five full platform users. Basic users are free, core users cost $49 per user per month, and full platform users cost $10 for the first and $99 for each additional Standard user, or $349 per user on annual Pro commitments ($418.80 monthly pay as you go). Enterprise pricing is by contract.
- Data options and compliance Data Plus costs $0.60 per GB and adds up to 90 days of extra retention, advanced log obfuscation, streaming export and, for Enterprise customers, FedRAMP Moderate and HIPAA eligibility. Storing data in the EU data center costs an additional $0.05 per GB. Free accounts stop ingesting data for the rest of the month once the 100 GB allowance is exceeded.
Where New Relic fits
Monitoring application performance
An APM agent is installed in the application runtime for one of the seven supported languages, or the application is instrumented with an OpenTelemetry SDK that exports OTLP to New Relic. The APM summary then shows response time, throughput, error rate and Apdex, with drill-down into transactions, databases, external services and distributed traces. Logs in context connects application log lines to the same transactions.
Watching hosts, containers and Kubernetes clusters
The infrastructure agent runs on Linux, Windows and macOS hosts and reports CPU, memory, storage, network, processes and inventory. In Kubernetes, the integration deploys collectors into the cluster and populates the cluster explorer with nodes, pods and containers. Cloud integrations add provider metrics for AWS, Azure and Google Cloud services, as documented in the infrastructure monitoring guide.
Centralizing and searching logs
Logs are forwarded from agents, Fluent Bit, Fluentd, Logstash, cloud forwarders or the Log API and stored as Log events. The logs UI supports search by text or attribute, live tail, pattern grouping, parsing rules and drop filters, and NRQL queries can turn log data into charts or alert conditions. Data partitions and data access control restrict which user groups see which logs.
Measuring real user and synthetic experience
The browser agent collects page loads, Core Web Vitals, JavaScript errors and AJAX timings from real visitors, and mobile agents report crashes and network requests from apps on Android, iOS and cross-platform frameworks. Synthetic monitors check pages and scripted user flows on a schedule from public or private locations, which gives availability data independent of real traffic.
Alerting and incident investigation
Alert conditions based on NRQL queries, thresholds or anomaly detection are grouped into policies. Correlated alert events become issues, and workflows route notifications to destinations. Since 2026, New Relic Autopilot can start an investigation when an alert fires, collect evidence across services and propose likely causes, inside the New Relic UI, in Slack or from automated workflow actions, according to the Autopilot release announcement.
Controlling observability spend
Billing is based on GB ingested after processing, on user types or compute capacity units, and on add-ons such as extra retention or synthetic checks. Drop filters and data transformation rules reduce what is stored, and Feature Control Manager toggles Advanced Compute capabilities. The pricing page lists the per-GB and per-user rates for each edition.
Reviews of New Relic
Be the first to share your experience with New Relic.
Write a review
Loading review form…
Found New Relic useful? Upvote it todayYour vote helps other IT teams find it in the daily ranking.