
What is Zabbix?
Zabbix is a distributed monitoring solution for the performance and availability of network devices, servers, virtual machines, applications, databases, cloud services and other IT resources. The README lists resource discovery, agent-based and agentless metric collection, problem detection with event correlation and root cause analysis, alerts through channels such as Slack, Jira, Microsoft Teams, email and SMS, dashboards with graphs, geomaps and network maps, and multitenant and distributed monitoring. Data can also be streamed over HTTP, and the product includes reporting, auditing and service SLA calculation.
Zabbix is developed by Zabbix LLC. Its about page states that the company began in 2005 with a group led by Alexei Vladishev, has headquarters in Latvia and offices in the USA, Brazil, Mexico, Japan and France; the contact page gives an address in Riga. The software has no license fee: the subscriptions page states that Zabbix is free to download, deploy and use, and that paid subscriptions cover technical support and related services. Zabbix Cloud is a separate hosted service.
A Zabbix installation consists of the Zabbix server, an optional set of Zabbix proxies, Zabbix agent or agent 2 on monitored hosts, a database and a PHP web frontend. The server is written in C and the frontend in PHP, and agent 2 is written in Go with some C code reused from the classic agent, collecting data through plugins. The source is published in the zabbix/zabbix repository under AGPL-3.0-only. Distribution options on the download page include packages, official container images, a virtual appliance, source code, Windows and Unix agents, and images for AWS, Azure, Google Cloud and Red Hat OpenShift.
The current release line is Zabbix 8.0 LTS, released on November 5, 2026. Under the life cycle policy, LTS releases receive three years of full support and two further years of limited support; for 8.0 these end on November 30, 2029 and November 30, 2031, and for 7.0 LTS on June 30, 2027 and June 30, 2029. The What's new in 8.0 page lists OpenTelemetry collection of traces, metrics and logs, application performance monitoring, ClickHouse as a history backend, complex event processing, an MCP server for AI agents, configurable table views, a new dark blue theme, a Scatter Plot widget, Geomap clustering and new templates; a mobile app is announced as coming soon.
Similar monitoring tools on iThub include Nagios, Prometheus and Netdata.
Key capabilities
- Zabbix server The central process receives data from agents and proxies, evaluates triggers, generates events and runs actions. The server runs on Linux, macOS, IBM AIX, FreeBSD, OpenBSD, Solaris, NetBSD and HP-UX; Windows is not supported as a server platform. A native high-availability setup runs several server nodes against the same database.
- Zabbix agent and agent 2 The classic agent is available for the server platforms and Windows (XP 64-bit / Server 2003 and later). Agent 2 is written in Go, collects data through plugins and supports Linux and Windows (Windows 10 32-bit / Server 2016 minimum).
- Agentless monitoring According to the README, metrics can also be collected without an agent from devices, sensors, virtualization and container platforms such as Docker and Kubernetes, cloud infrastructure, databases, web pages, Java applications and API endpoints.
- Zabbix proxy A proxy collects monitoring data from one or more devices and sends it to the server on its behalf. The documentation describes it for monitoring remote locations, branches and networks without local administrators, and the proxy can use SQLite as its local database.
- Templates and discovery Out-of-the-box templates provide items, triggers and dashboards for operating systems, network equipment, databases, applications and cloud services; the integrations catalog lists them. Network discovery adds hosts, and low-level discovery creates items for entities such as file systems and interfaces automatically. SNMP monitoring covers devices such as switches, routers, printers and UPS units.
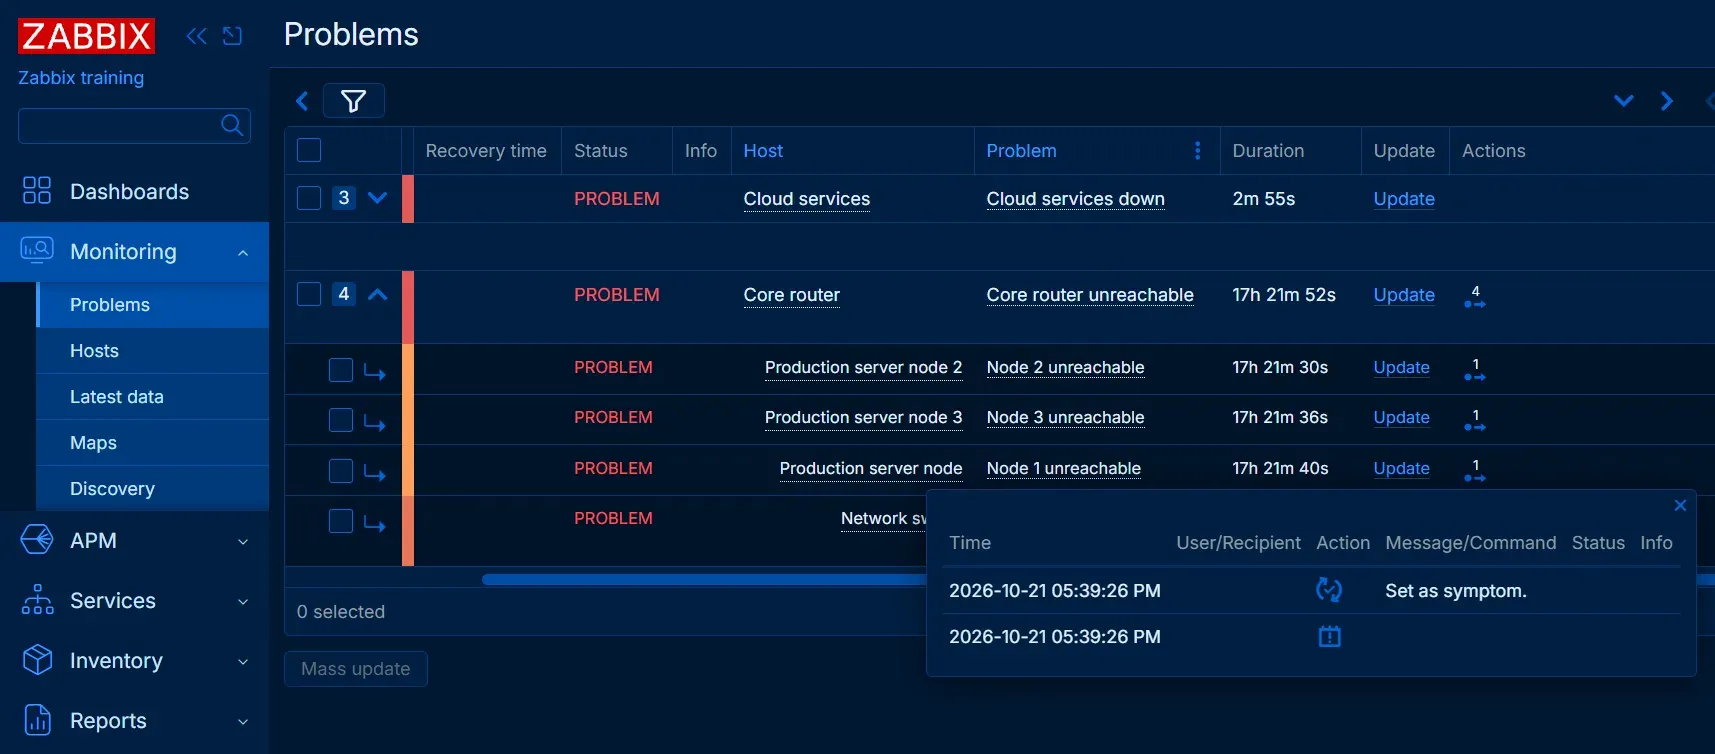
- Triggers, problems and event correlation Trigger expressions turn collected values into problems with severities from Information to Disaster. Zabbix 8.0 adds complex event processing for root cause analysis, event correlation and noise reduction, where related problems can be marked as symptoms of a cause.
- Alerts and notifications Actions send notifications through media types such as email, SMS, Slack, Jira and Microsoft Teams, and can run remote commands. Escalations repeat or change notifications over time.
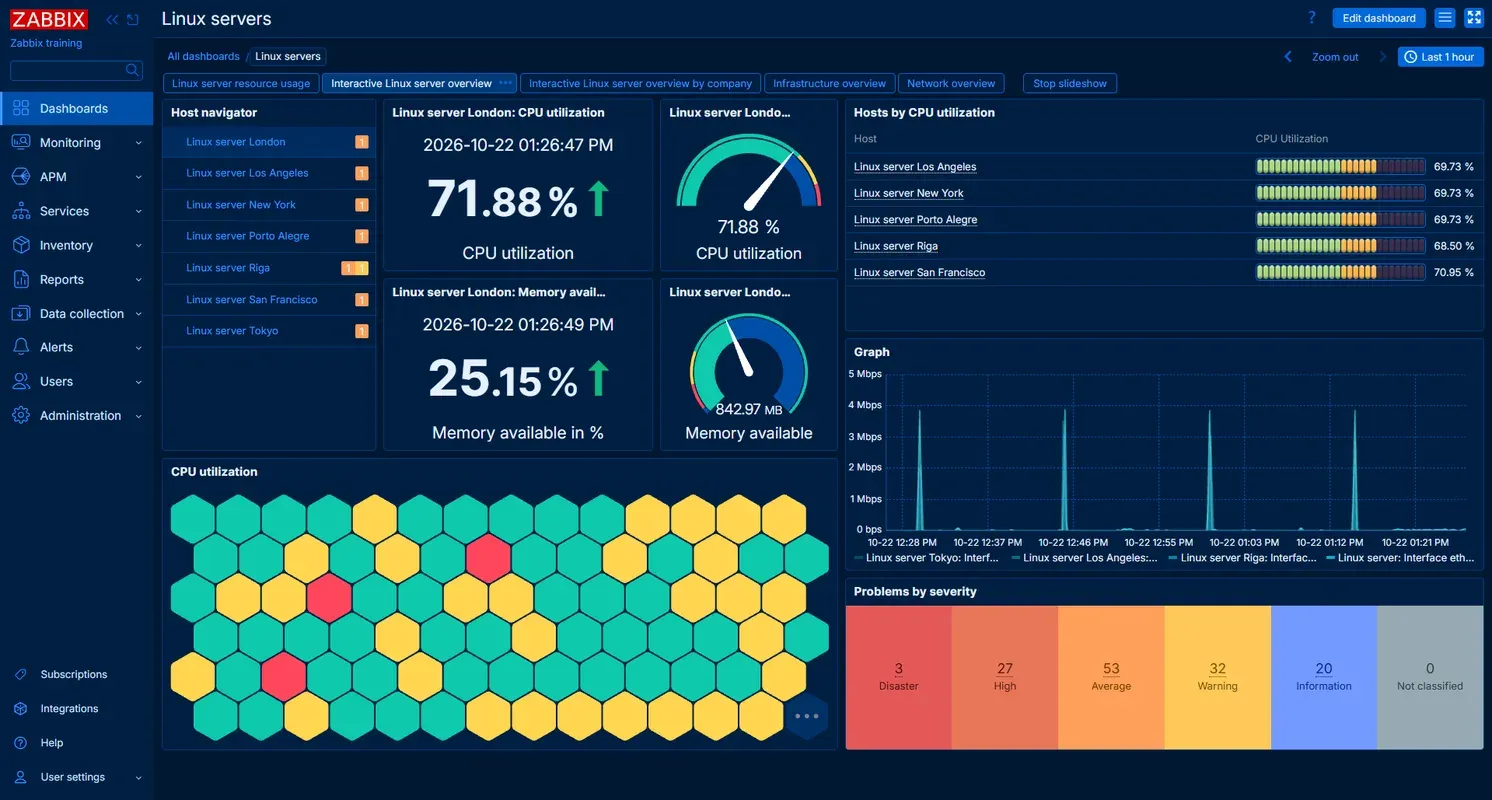
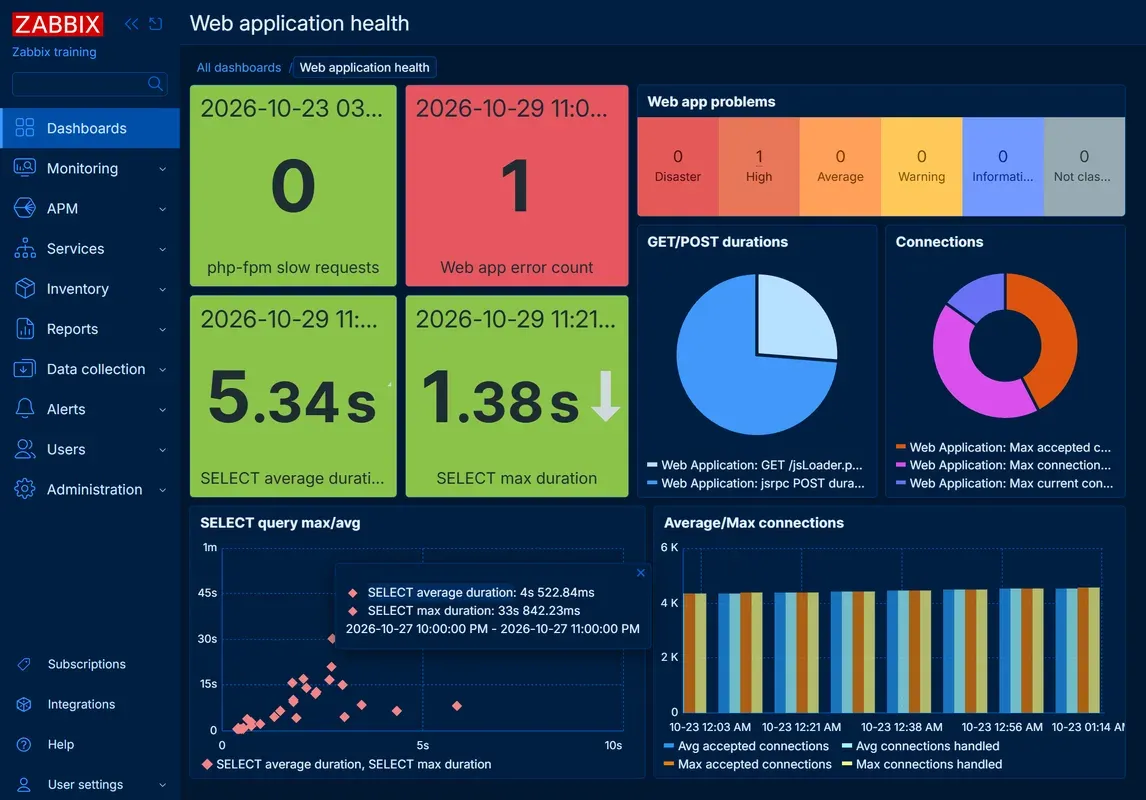
- Dashboards and visualization The web frontend provides dashboards with widgets such as gauges, honeycomb, graphs, top hosts, problems by severity, geomaps and network maps. Version 8.0 adds a Scatter Plot widget, Geomap clustering, configurable table views and a dark blue theme. The frontend requires a screen width of at least 1200 px.
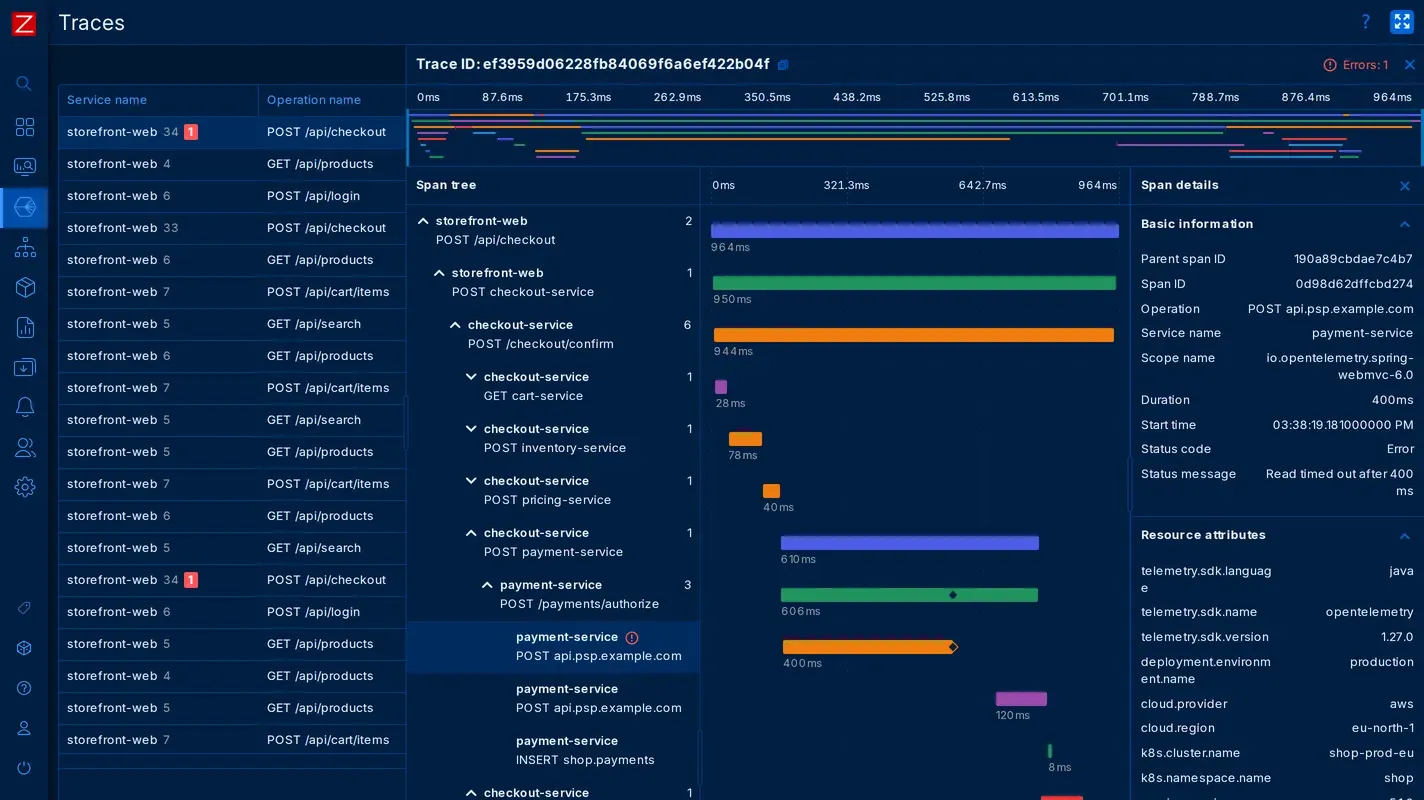
- OpenTelemetry and APM Zabbix 8.0 collects and visualizes OpenTelemetry traces, metrics and logs, and adds an APM section with trace views, span trees and span details for cloud-native applications.
- Database backends For 8.0 the requirements list MySQL or Percona Server 8.4 to 9.7, MariaDB 10.11 to 12.3, PostgreSQL 15 to 18 with optional TimescaleDB 2.20 to 2.29, Elasticsearch 8.0 to 9.5 and ClickHouse 26.3 to 26.9 for history storage, and SQLite for proxies.
- Zabbix API The Zabbix API is an HTTP-based API shipped with the web frontend. It retrieves and modifies configuration and gives access to historical data.
- MCP server Zabbix 8.0 adds an MCP server that lets AI agents interact with Zabbix while respecting user permissions, according to the release overview.
- Services and SLA The Services section builds a service tree from problem tags and calculates SLA compliance, with reports on service availability.
- Web frontend requirements The frontend needs PHP 8.2 to 8.5 and Apache 2.4 or Nginx 1.20 or later. The requirements page warns about vulnerable PHP patch versions below specific releases.
- Installation options Packages, the official containers (the documentation calls Docker Compose the quickest way to deploy Zabbix), a virtual appliance, source code and public cloud images are available from the download page.
- Zabbix Cloud The Zabbix Cloud page lists tiers by new values per second, from Nano (50 NVPS) at $50 per month with an initial 10 GB of storage to 2xLarge (10000 NVPS) at $5000, as starting points. It offers a 5-day free trial and a choice of 5 regions.
- Support subscriptions Paid subscriptions are Silver (245 EUR or 325 USD per month billed annually, one server, 8x5 support), Gold (from 660 EUR or 825 USD per month), and Platinum, Enterprise and Global on request, with increasing response times, contacts and consultancy hours.
Where Zabbix fits
Server and operating system monitoring
Agents on Linux and Windows hosts report CPU, memory, disk, network and process metrics, and OS templates add triggers for common problems. Dashboards show resource usage per host and across host groups, as in the Linux servers dashboard shown in the 8.0 materials.
Network device monitoring
Switches, routers, firewalls and other equipment are monitored without an agent, using SNMP items, network templates and discovery rules. Network maps and geomaps visualize device status, and event correlation can mark downstream problems, such as nodes behind an unreachable core router, as symptoms of one cause.
Distributed monitoring of remote sites
Zabbix proxies at branches or in separate network segments collect data locally and forward it to the central server, so remote locations behind firewalls are covered without opening direct paths to every host. Multitenancy separates data and permissions for departments or customers.
Application and cloud-native observability
With 8.0, applications instrumented with OpenTelemetry send traces, metrics and logs to Zabbix, where the APM views show services, operations and span timing next to infrastructure metrics. Templates cover Kubernetes and several cloud platforms.
Alerting and incident handling
Triggers raise problems with severities, actions notify on-call staff through email, chat or ticketing integrations, and remote commands can run automated remediation. The problems view records acknowledgements and updates for each event, and escalations define custom scenarios for repeated notifications or remote commands.
Service availability and SLA reporting
Business services are modeled as a service tree linked to problem tags, and Zabbix calculates SLA figures and availability reports for each service over defined periods. The SLA documentation describes SLA configuration and reports.
Reviews of Zabbix
Be the first to share your experience with Zabbix.
Write a review
Loading review form…
Found Zabbix useful? Upvote it todayYour vote helps other IT teams find it in the daily ranking.