

What is Better Stack?
Better Stack is a SaaS observability and incident management platform that combines uptime monitoring, on-call scheduling and alerting, incident management in Slack and Microsoft Teams, status pages, log management, OpenTelemetry-native tracing, infrastructure metrics, error tracking, real user monitoring and an AI SRE agent. Its home page describes it as an AI SRE observability stack and compares its pricing with Datadog, with a published example calculation and its assumptions.
The company is Better Stack, Inc., as given in the site footer. According to its careers page, Better Stack was founded in 2021, has raised $28.6 million in funding and is used by more than 300,000 developers; most open roles are listed as remote or in Prague. Investors named on that page include Lachy Groom, Rahul Mehta of DST Global, Aaron Levie, Madhu Muthukumar and Ryan Petersen.
The platform is split into two product areas. Incidents covers uptime monitors, heartbeats for cron jobs, Playwright-based transaction checks, on-call schedules and escalation policies, call routing, status pages and incident management. Telemetry covers logs and traces, metrics, error tracking, session replay and web events, ingested through the Better Stack collector, OpenTelemetry, Vector or an HTTP API, as described in the documentation. An MCP server at mcp.betterstack.com connects AI assistants to Incidents and Telemetry data.
Better Stack is a closed-source hosted service; there is no self-hosted edition, although enterprise customers can request a custom cluster or VPC deployment and logs can be stored in the customer's own S3 bucket for an extra fee. The security page states that the company is SOC 2 Type 2 compliant and GDPR compliant, that data is stored by default in EU regions in DIN ISO/IEC 27001-certified data centers, that data is encrypted at rest with AES-256 and in transit with TLS, and that the service is not HIPAA compliant. Custom data locations are offered for enterprise accounts, and the quote form lists United States, Europe and Singapore as data regions.
Pricing is published on the pricing page, with a free tier for personal projects, per-responder licenses for incident features and usage-based telemetry pricing; a 60-day money-back guarantee applies. iThub has also published an article on Better Stack uptime, on-call, status pages and logs. Similar products listed on iThub include OneUptime, Uptime Kuma and Datadog.
Better Stack screenshots
Explore the interface. Open a screenshot to view it at full size.
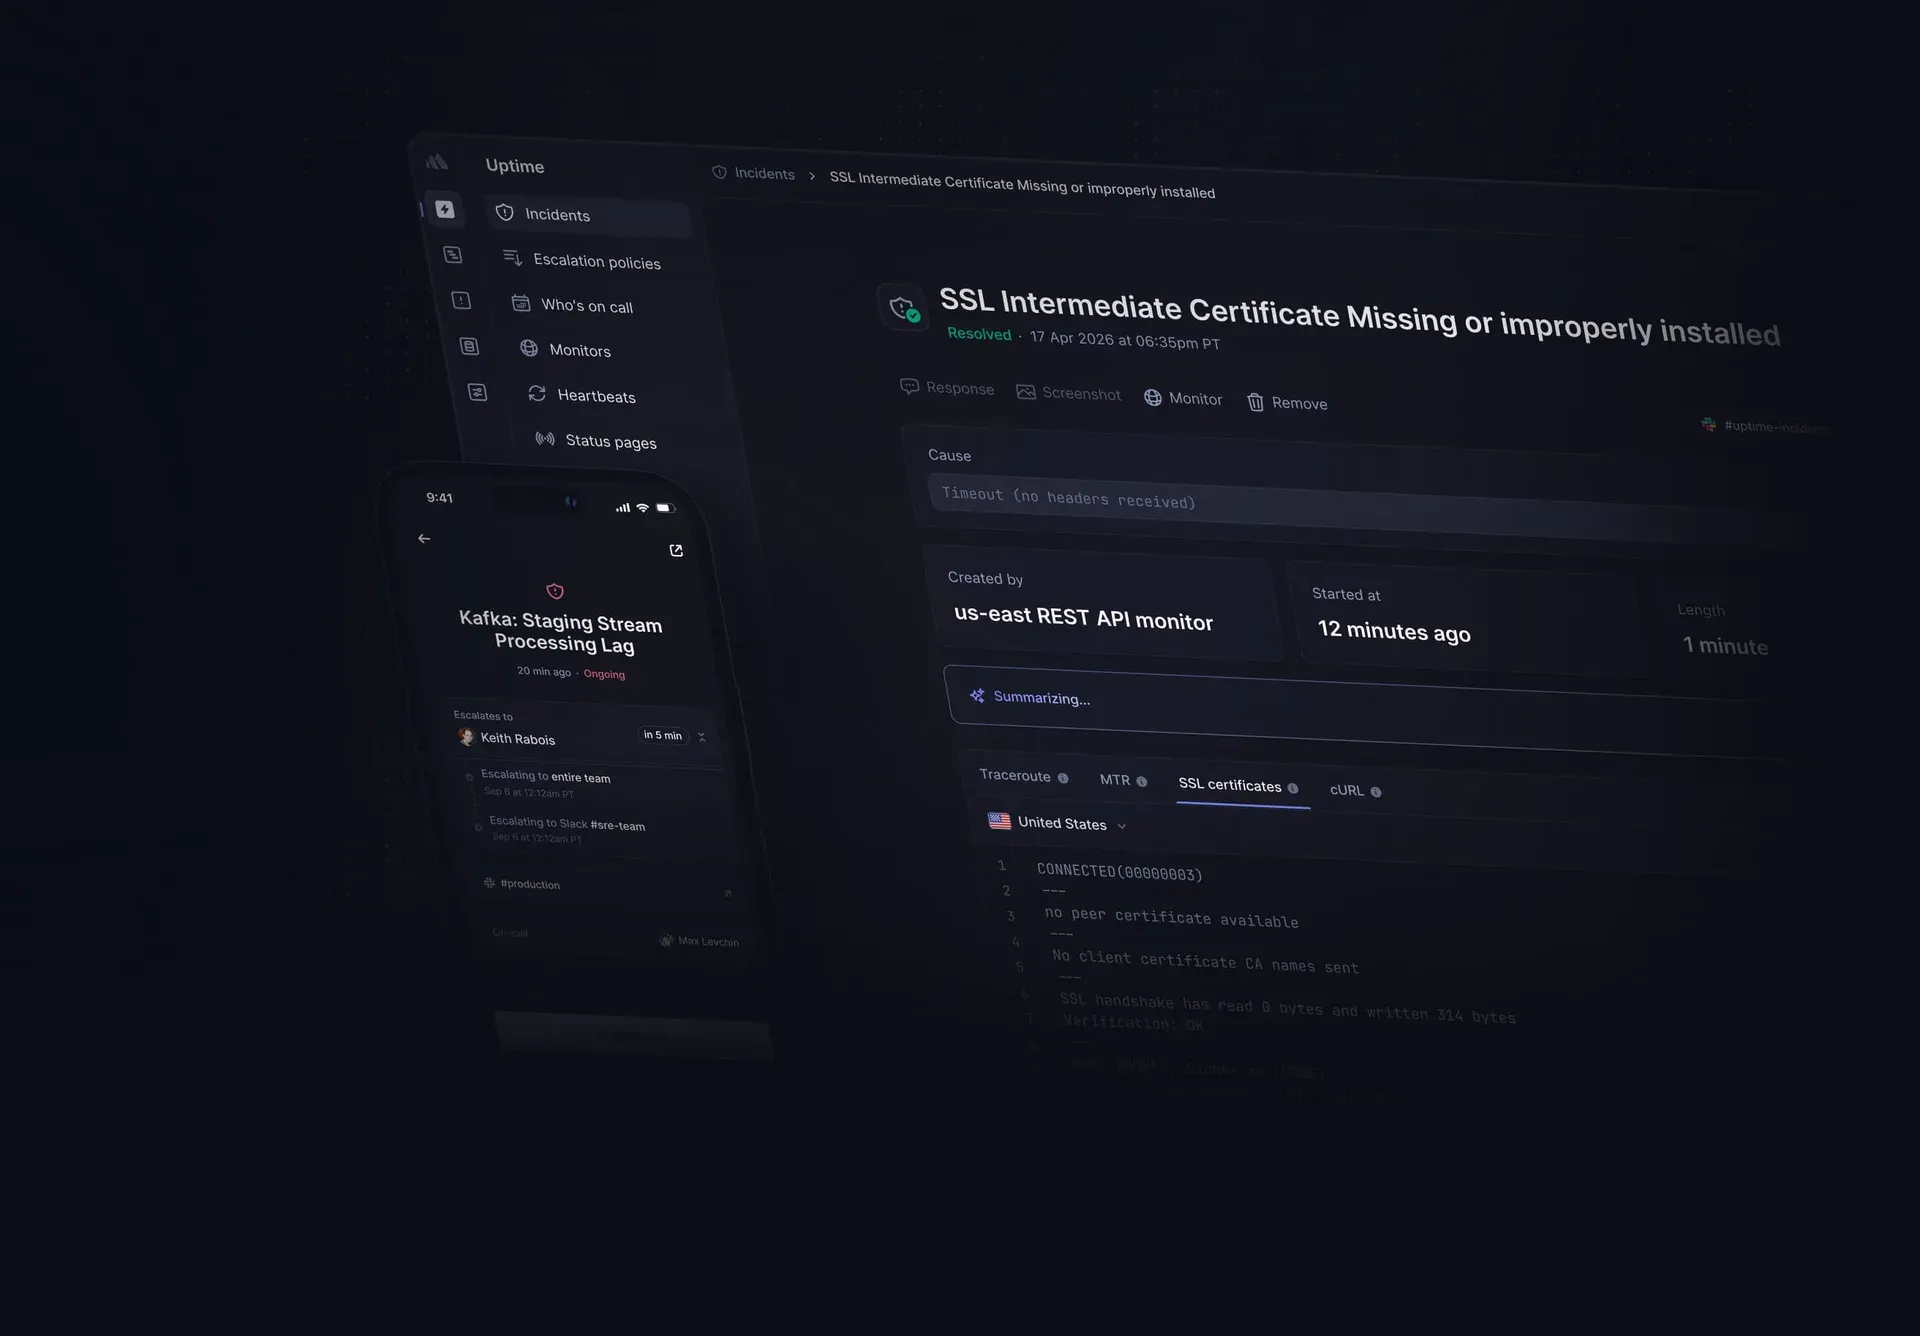
Official product image of an uptime incident with SSL diagnostics and a mobile on-call escalation.
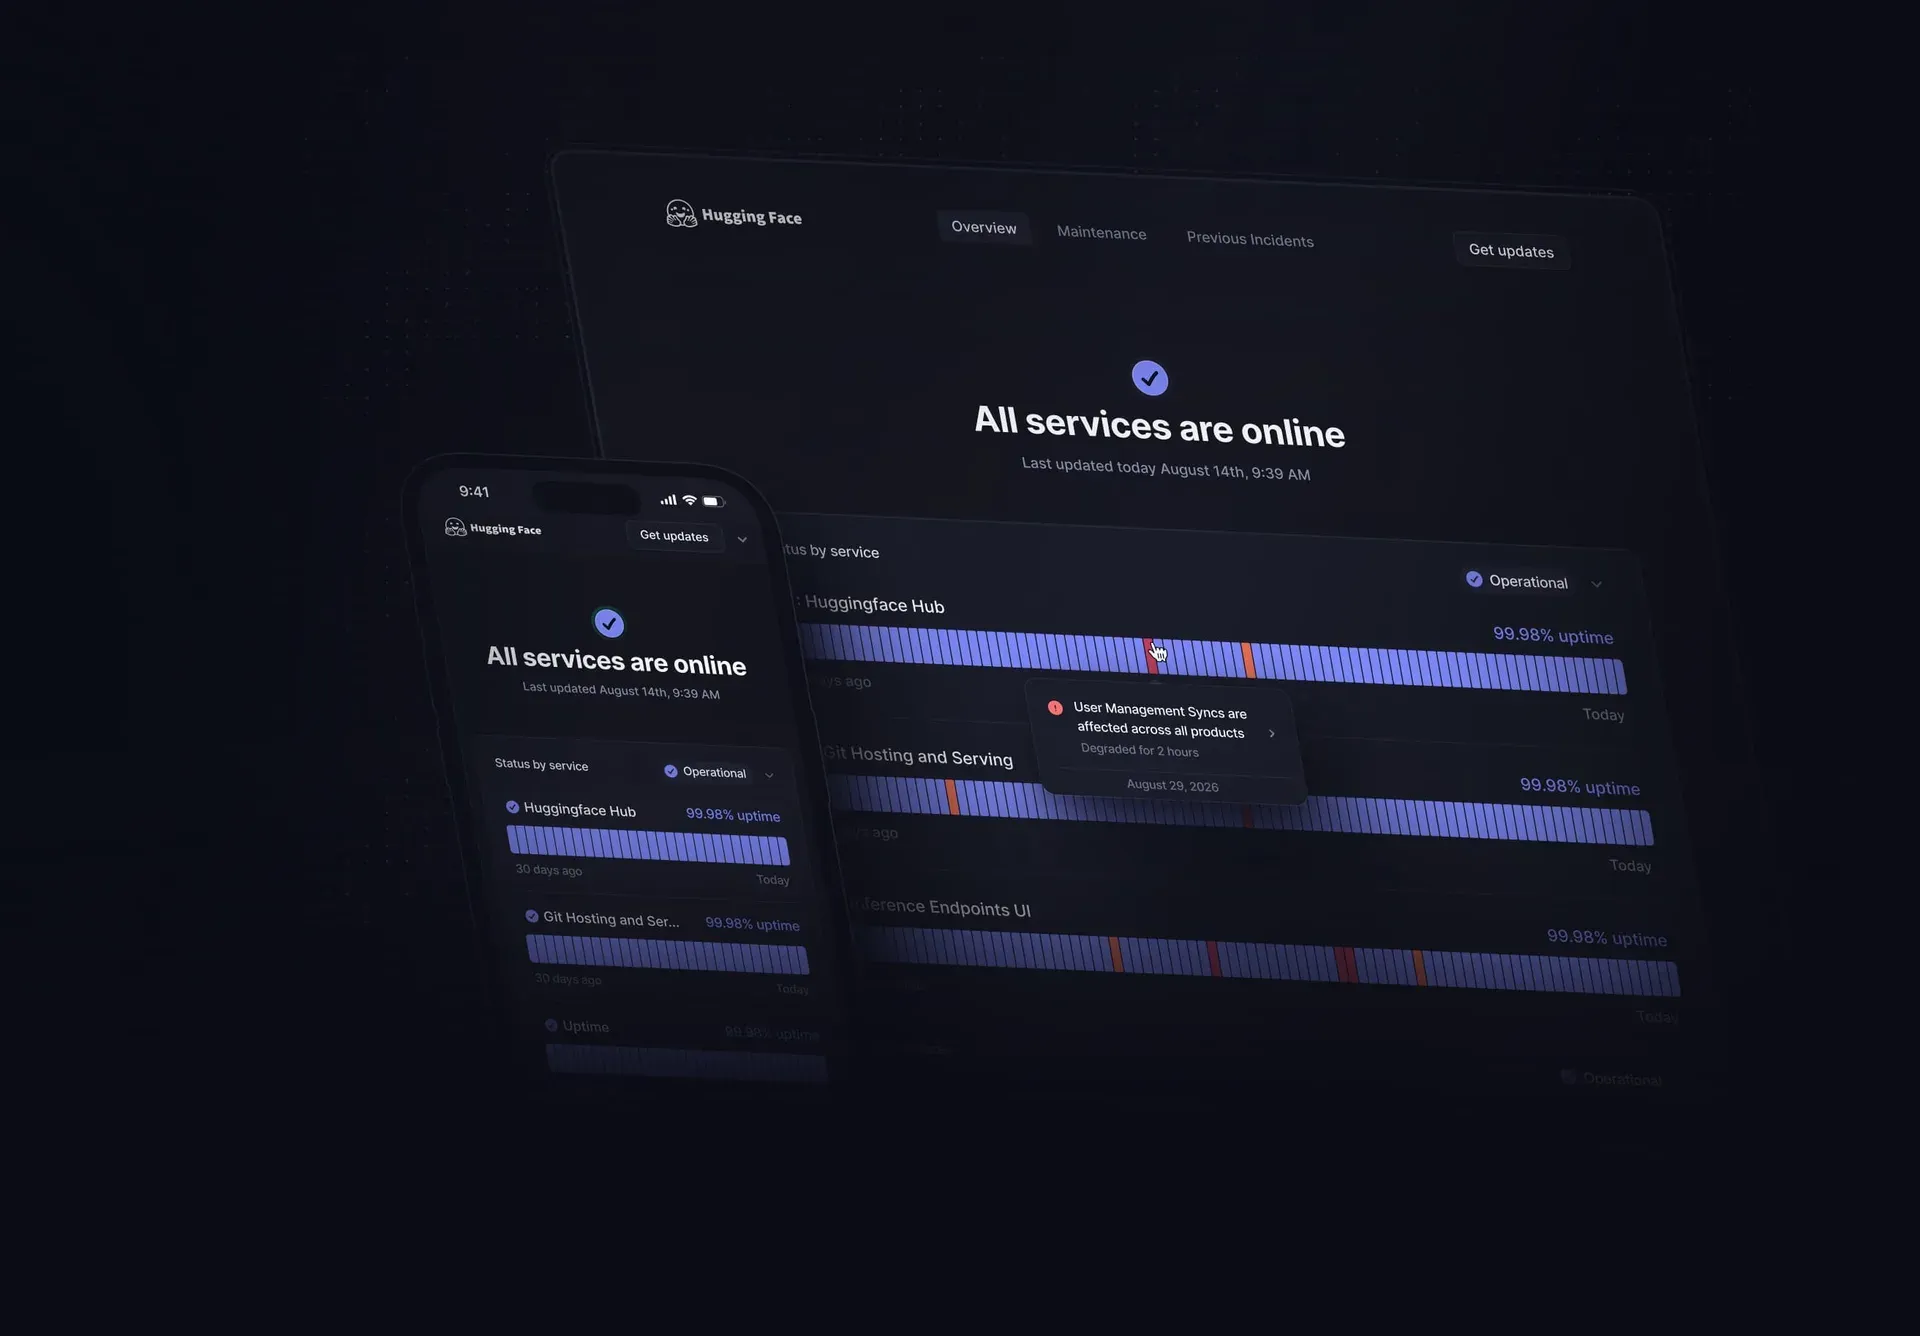
Official product image of a hosted status page with per-service uptime history.
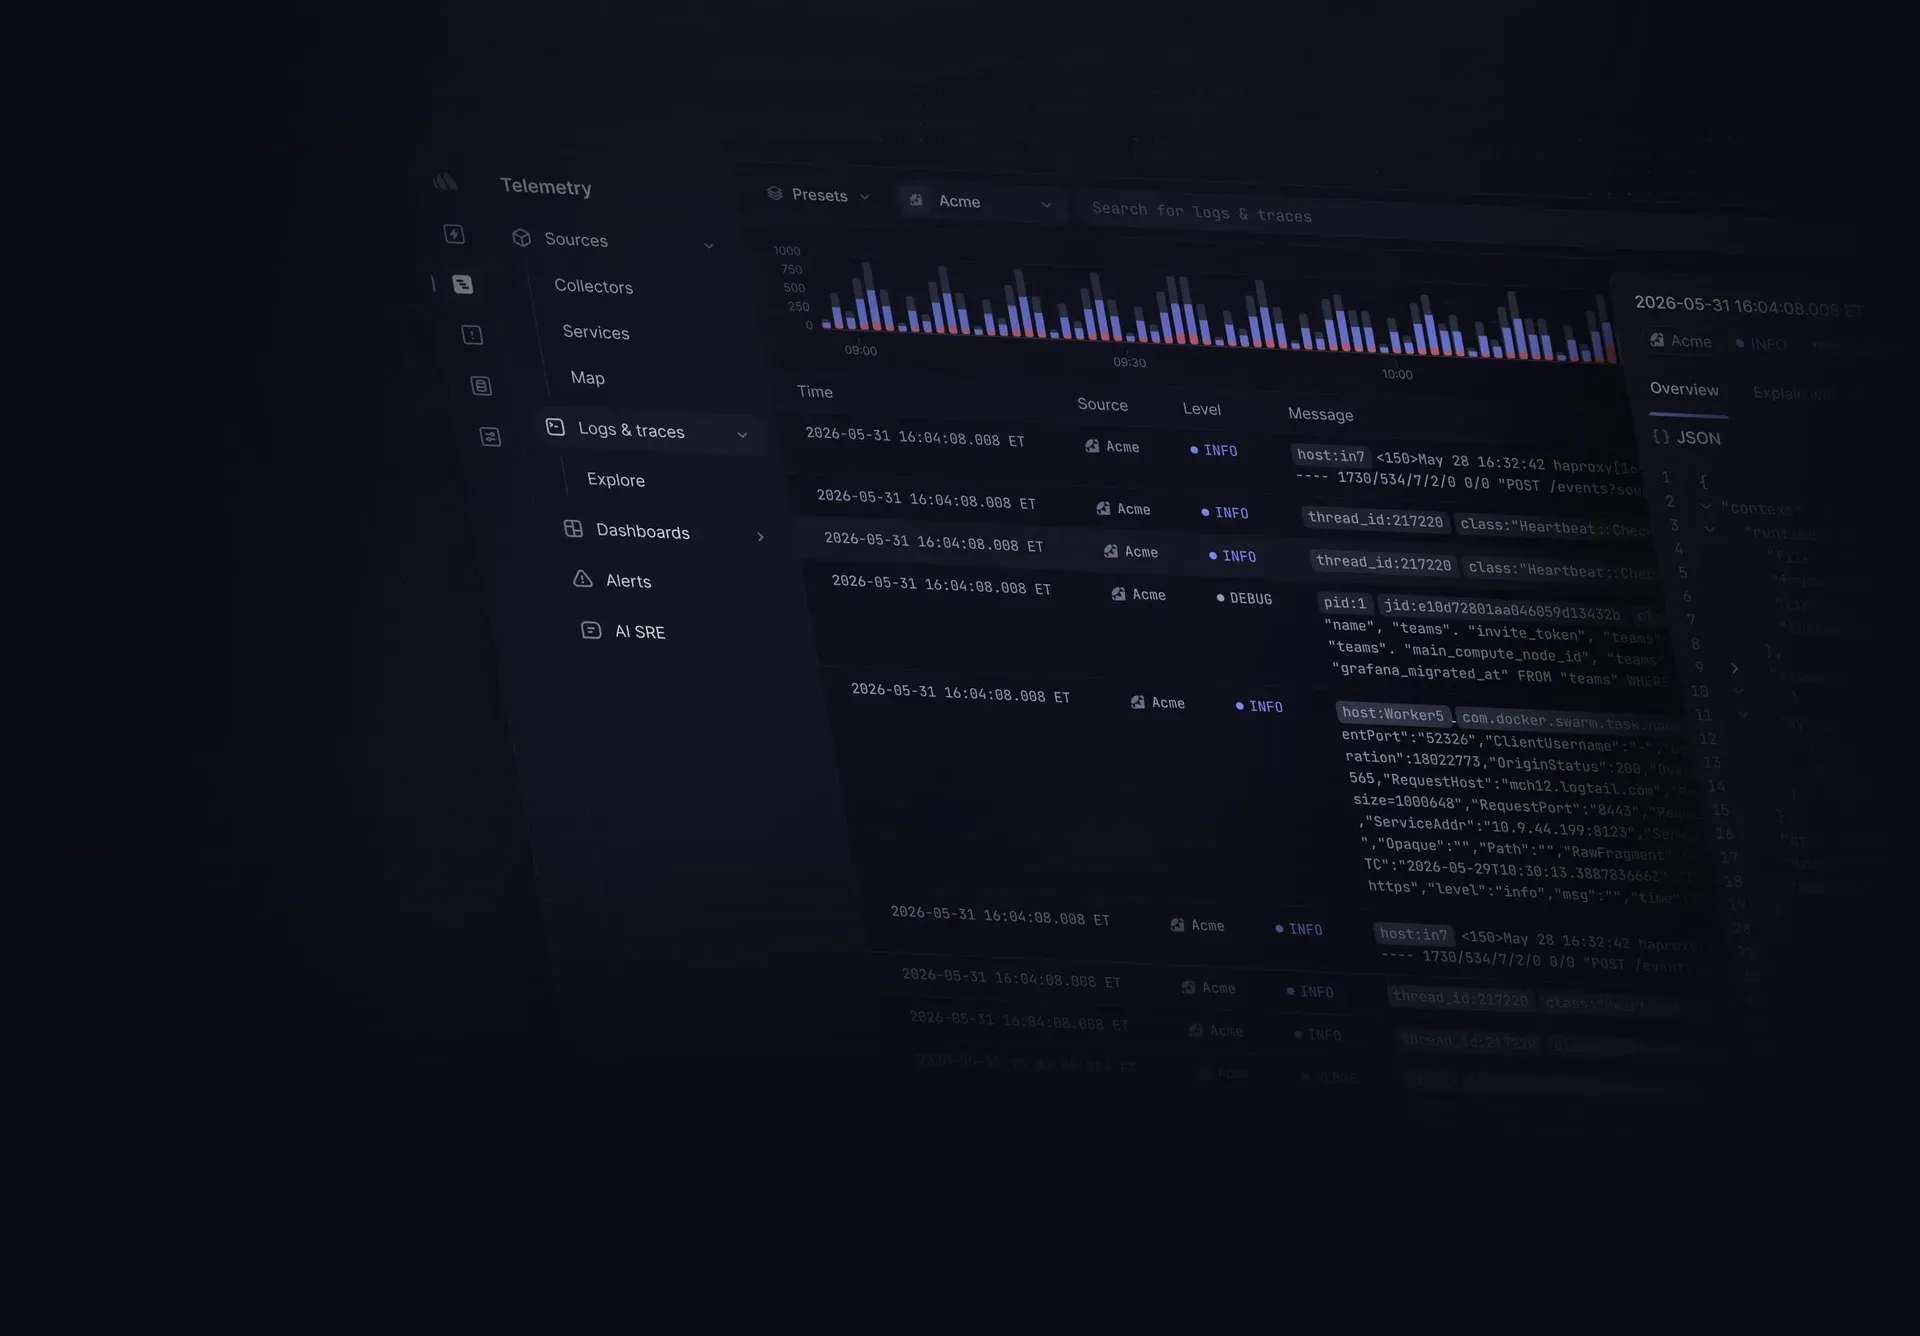
Official product image of the Telemetry logs and traces explorer.
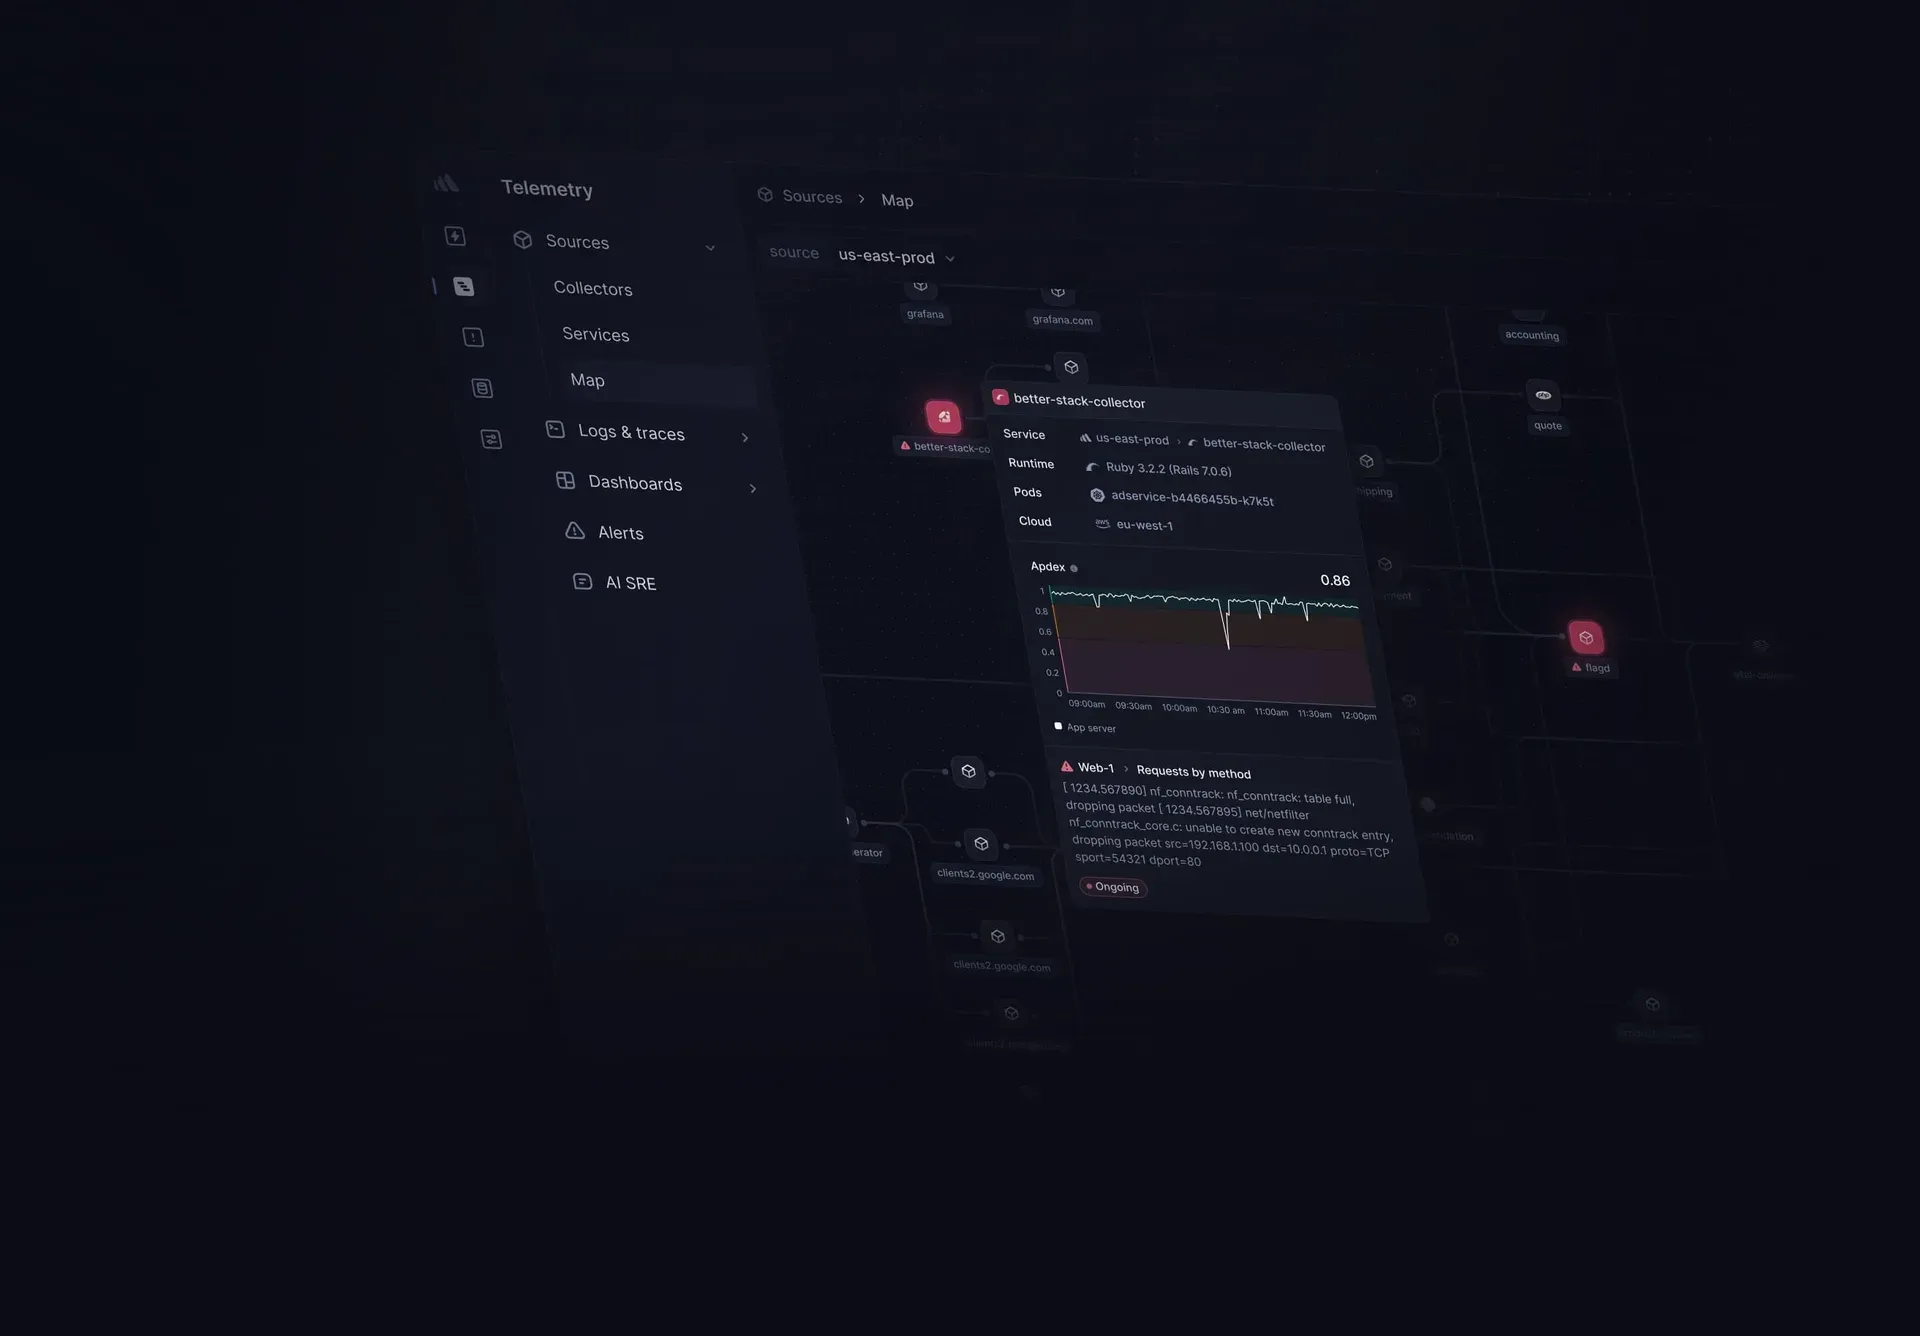
Official product image of the eBPF-based service map with Apdex for one service.
Source: official Better Stack project page.
Key capabilities
- Plans and pricing The free tier for personal projects includes 10 monitors and heartbeats, 1 status page, Slack and e-mail alerts, 100,000 exceptions, 5,000 session replays, 3 GB of logs and 3 GB of traces retained for 3 days and 30 GB of metrics. A Responder license, which adds on-call, monitoring and status pages with unlimited phone and SMS alerts, costs $34 per month or $29 billed annually; other team members are free. Telemetry bundles with 30-day log retention start with Nano at $30 per month or $25 billed annually for 40 GB each of traces, logs and metrics, and additional log ingestion is listed at $0.15 per GB monthly or $0.10 per GB annually.
- Uptime monitoring Monitors cover HTTP(S) status and keyword checks, ping, TCP and UDP ports, SSL certificates, TLD expiration, DNS servers and POP3, IMAP and SMTP, with IPv6 support, multi-location and geo-specific checks and multi-step incident verification. The fastest check frequency is 30 seconds, and the free tier includes 10 monitors and heartbeats.
- Error screenshots and network diagnostics When a check fails, Better Stack records the API error and takes a screenshot of the page. Timeouts are explained with traceroute and MTR output from edge locations, and an Explain with AI function analyses MTR, traceroute, SSL and connection errors.
- Transaction monitoring with Playwright Hosted Playwright checks run a real Chrome browser with a JavaScript runtime to test multi-step website interactions. Pricing is $1 per 100 Playwright minutes.
- Heartbeats for cron jobs Heartbeats monitor scheduled jobs and serverless workers with a configurable grace period and up to 1-second resolution. Ten heartbeats are included; additional 10 heartbeats cost $20 per month, or $17 billed annually.
- On-call scheduling and escalation Responders get on-call calendars, escalation policies, Google and Outlook calendar integration, ICS export and iOS and Android apps. Each Responder license includes unlimited phone call, SMS, push, e-mail and Slack alerts.
- Incident management in Slack and Teams Incidents can be run from Slack or Microsoft Teams with a /incident command, channel-based or thread-based workflows, a dedicated channel per incident, an incident timeline and post-mortems. Smart incident merging acknowledges several simultaneous incidents in one action.
- Call routing Incoming phone calls to a dedicated number are routed to the current on-call person and create incidents automatically, with call transcripts and number allow-listing. Numbers are available in the USA, Canada, the EU and the UK at $250 per number per month, or $208 billed annually.
- Status pages Public or private branded status pages on a custom sub-domain include maintenance notices, subscriber notifications for 1,000 subscribers, embeddable badges and charts and multi-language support in beta. Paid options include custom CSS and JavaScript, password authentication, IP allowlisting, single sign-on, white-labeling and sending e-mail from the customer's own domain.
- Log management Structured logs are ingested from many sources, transformed with VRL or JavaScript and queried with a drag-and-drop builder, PromQL or SQL, including through an HTTP API. Features include live tail, schema-less storage, anomaly detection alerts, logs-to-metrics conversion, PII anonymisation, spending alerts and archival to S3.
- Tracing and service map Traces are ingested over OTLP from the Better Stack collector or an OpenTelemetry setup. An eBPF-based service map shows network flows and auto-instruments databases, and Apdex and RED metrics summarise service health, as described in the tracing documentation.
- Infrastructure metrics Metrics are collected through Prometheus or OpenTelemetry or generated from logs, shown in ready-made and drag-and-drop dashboards and queryable with SQL. Grafana and Datadog dashboards can be imported.
- Error tracking Error tracking is compatible with Sentry SDKs, keeps exceptions for 90 days and includes release tracking, error merging, snoozing and Linear, Jira, Slack and Microsoft Teams integrations. It provides bug-fix prompts for Claude Code and Cursor.
- Real user monitoring Session replay, web vitals, product analytics, funnels and auto-captured web events are offered as part of the Telemetry area, with sampling and the option to exclude sensitive HTML elements from replays.
- AI SRE A Slack-native AI SRE agent investigates incidents using logs, metrics, traces, errors and web events, writes post-mortems and can create GitHub pull requests and Linear tickets. It is billed by consumption, with models from Anthropic, OpenAI, Google and others selectable in the app.
- MCP server The MCP server runs as a remote HTTP server at mcp.betterstack.com and authenticates with OAuth or an API token. Plugins are offered for Claude, Grok and Google Antigravity, and Cursor has a one-click install.
- APIs and Terraform REST APIs cover monitors, heartbeats, on-call and incidents, status pages and telemetry queries, documented in the Uptime API guide, and a Terraform provider manages configuration as code. Webhooks and Zapier integrations are also available.
- Security and access control Google single sign-on is included; Azure and Okta SSO cost $5 per user per month, and audit logs $250 per month. Two-factor authentication, role-based access control, team-level isolation and, for enterprise, SAML SSO, SCIM and custom data residency are listed.
- Reporting The reporting add-on at $5 per member per month, or $4 billed annually, tracks MTTA, MTTR, on-call duty, uptime SLA history and SLA and SLI indicators, with CSV export.
Where Better Stack fits
Monitoring a public website or API
Teams create HTTP, keyword, SSL or DNS monitors from several regions with check intervals down to 30 seconds. When a check fails, an incident is opened with the error response, a screenshot and traceroute or MTR output, and the current on-call person is notified by phone call, SMS, push, e-mail or Slack, escalating to the whole team if nobody acknowledges.
Running on-call rotations
Responders are placed in on-call schedules and escalation policies, which can be synchronised with Google or Outlook calendars. The on-call guide describes setup, and call routing lets customers reach the on-call engineer through a dedicated phone number.
Communicating incidents to customers
A status page on status.yourdomain.com shows current and past incidents, maintenance windows and uptime history per service, and subscribers receive updates by e-mail. Monitors connect directly to status page components, as described in the status page guide.
Watching cron jobs and backups
Each scheduled job pings a heartbeat URL when it finishes. If the ping does not arrive within the configured grace period, Better Stack opens an incident and alerts the on-call responder.
Centralising logs, metrics and traces
Engineers send logs, metrics and traces through the Better Stack collector, OpenTelemetry or Vector, then search them in live tail, build dashboards, convert logs into metrics and set anomaly alerts. Slow requests can be investigated from a trace to the related logs and metrics.
Investigating incidents with AI assistants
The AI SRE agent investigates an incident in Slack using telemetry data and drafts a post-mortem, while the MCP server exposes Incidents and Telemetry data to clients such as Claude, Cursor and other MCP-compatible tools.
Reviews of Better Stack
Be the first to share your experience with Better Stack.
Write a review
Loading review form…
Alternatives to Better Stack
 OneUptimeOneUptime is an open-source observability platform from HackerBay, Inc. that combines uptime and infrastructure monitoring, status pages, incident management, on-call paging and OpenTelemetry logs, metrics and traces, as a cloud service or self-hosted.
 Uptime KumaUptime Kuma is a self-hosted monitoring tool that checks HTTP, TCP, ping, DNS and Docker targets at 20-second intervals and publishes status pages.
 DatadogDatadog is a SaaS observability and security platform that collects metrics, traces, logs and events through its open-source Agent and 1,000+ integrations, with per-host and per-volume pricing across regional sites.