

What is OneUptime?
OneUptime is an open-source observability and incident management platform made by HackerBay, Inc., which does business as OneUptime. It checks that websites, APIs, servers and infrastructure respond, ingests the logs, metrics and traces that applications send, pages the person on call when something fails and publishes the state of each service on public or private status pages. Monitoring, incidents, on-call, telemetry, workflows and status pages share one project, one permission model and one interface. It is offered as the hosted OneUptime Cloud service or as software to run on your own servers.
The code lives in the OneUptime/oneuptime repository and is mostly TypeScript. The root LICENSE file places everything outside the ee/ directory under the Apache License 2.0; the ee/ directory is covered by the separate OneUptime Enterprise License. The project ships two container images: the Community Edition image contains no code from ee/, while the Enterprise Edition image adds those modules, and its production use needs an Enterprise license for the number of users. According to the edition comparison, SAML and OpenID Connect single sign-on are part of the Community Edition, while SCIM provisioning, audit logs, team compliance settings, custom roles, retention overrides and instance health dashboards belong to the Enterprise Edition. OneUptime Cloud runs the Enterprise Edition, and the cloud plan decides which of those features a project gets.
A self-hosted instance runs an app service (dashboard, API, status pages, telemetry ingest and background workers), an nginx-based ingress, a probe that executes monitor checks, a runner for runbook JavaScript steps and AI code fixes, and three datastores: PostgreSQL for configuration and state, ClickHouse for telemetry and Valkey for cache and queues. The Docker Compose guide runs all of this on one Linux server, and a Helm chart published at helm-chart.oneuptime.com deploys it on Kubernetes for larger or highly available installations. Each release also publishes the OneUptime infrastructure agent for Linux, Windows, macOS, FreeBSD and OpenBSD on amd64 and arm64, plus the OneUptime On-Call mobile app as an Android APK and an iOS IPA.
The latest GitHub release is 14.0.105, published on November 7, 2026. Its notes list 14 changes since 14.0.104: cloud cost right-sizing and budget alerts available over MCP and the CLI, checks of AWS log subscription limits in Cloud Streaming, status page logos embedded in emails, real-time rules that count and correlate events, a Stop step for playbooks, hardened credentials for cloud AI agents and a fix to form validation messages. Release assets include CycloneDX SBOMs and Grype vulnerability reports for each container image and a checksums file. Upgrades run npm run update on the release branch for Docker Compose, or helm upgrade to the matching chart version.
The documentation at oneuptime.com/docs is published in 17 languages and covers monitors, incidents, alerts, on-call, status pages, telemetry, dashboards, workflows, the API and CLI, Terraform and Crossplane, identity and installation. Community questions go to the OneUptime Slack workspace, bugs and feature requests to GitHub issues, and security reports follow the private process in the repository's SECURITY.md.
OneUptime screenshots
Explore the interface. Open a screenshot to view it at full size.
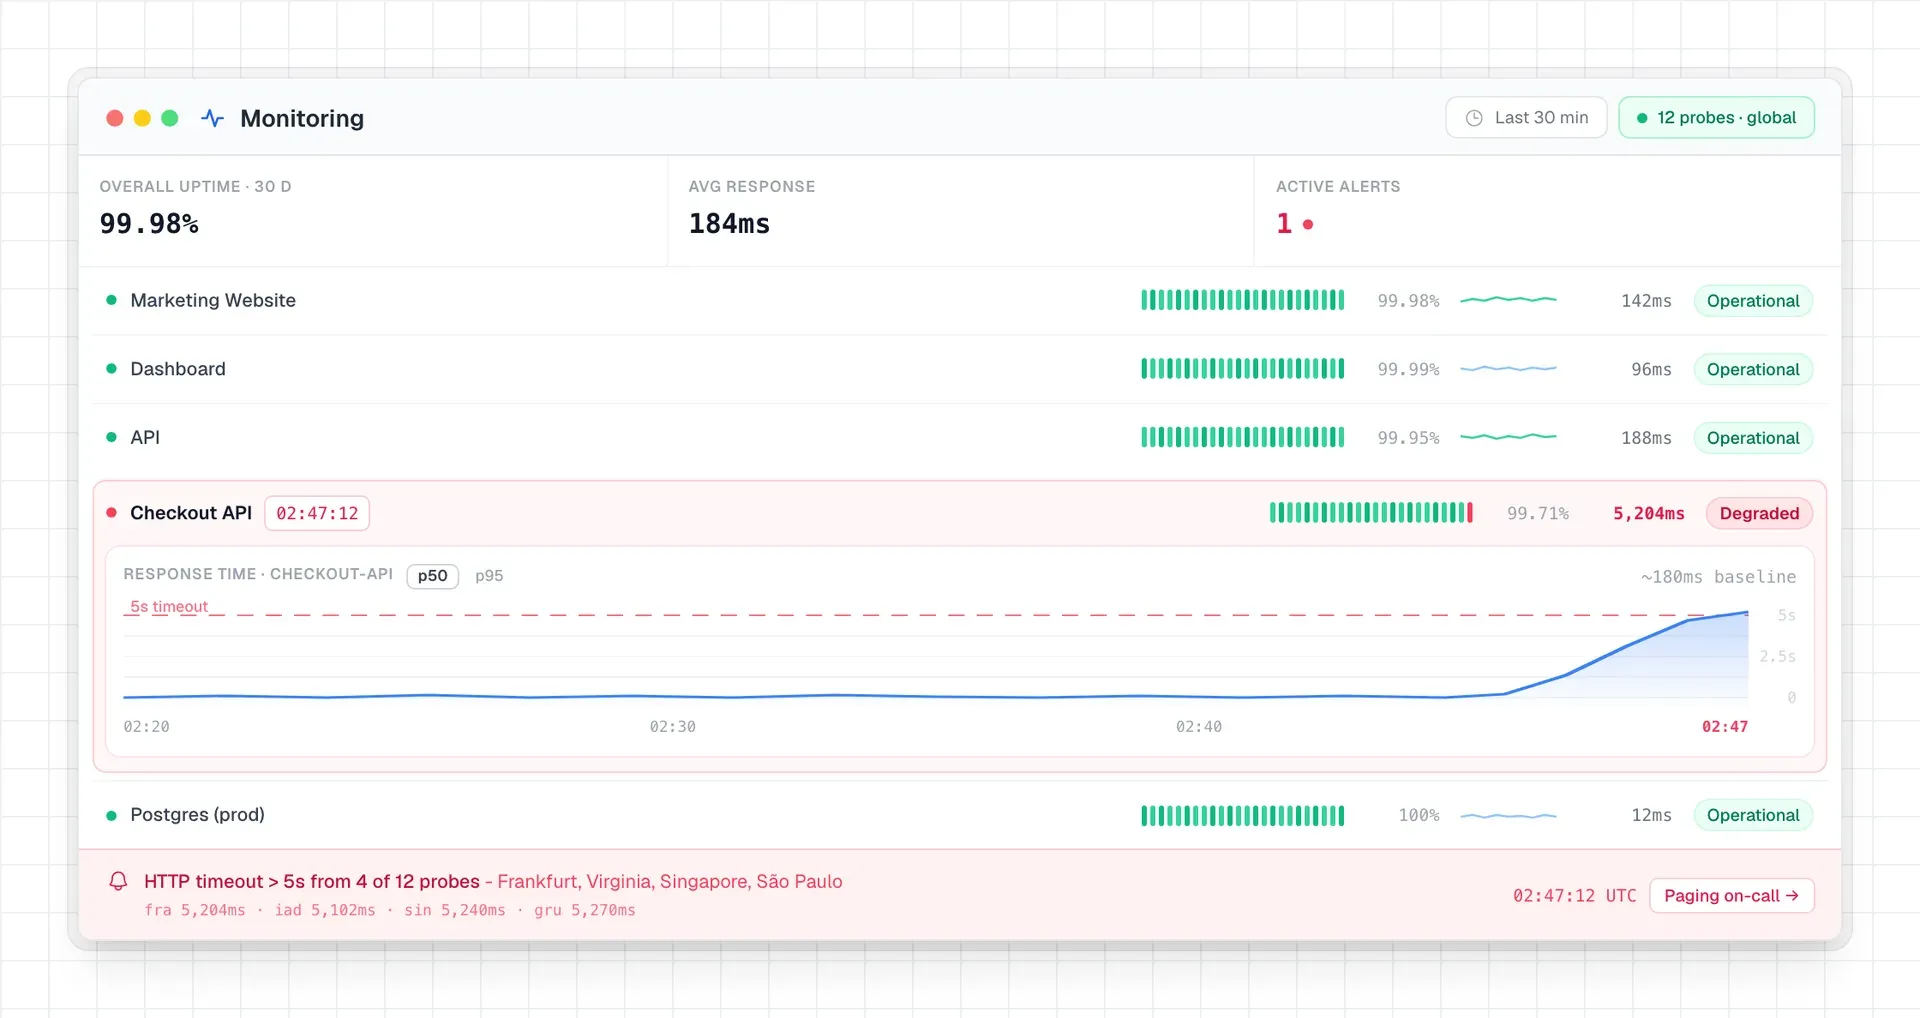
Official OneUptime README image: monitors with 30-day uptime, a response time chart and an HTTP timeout alert from several probe locations.
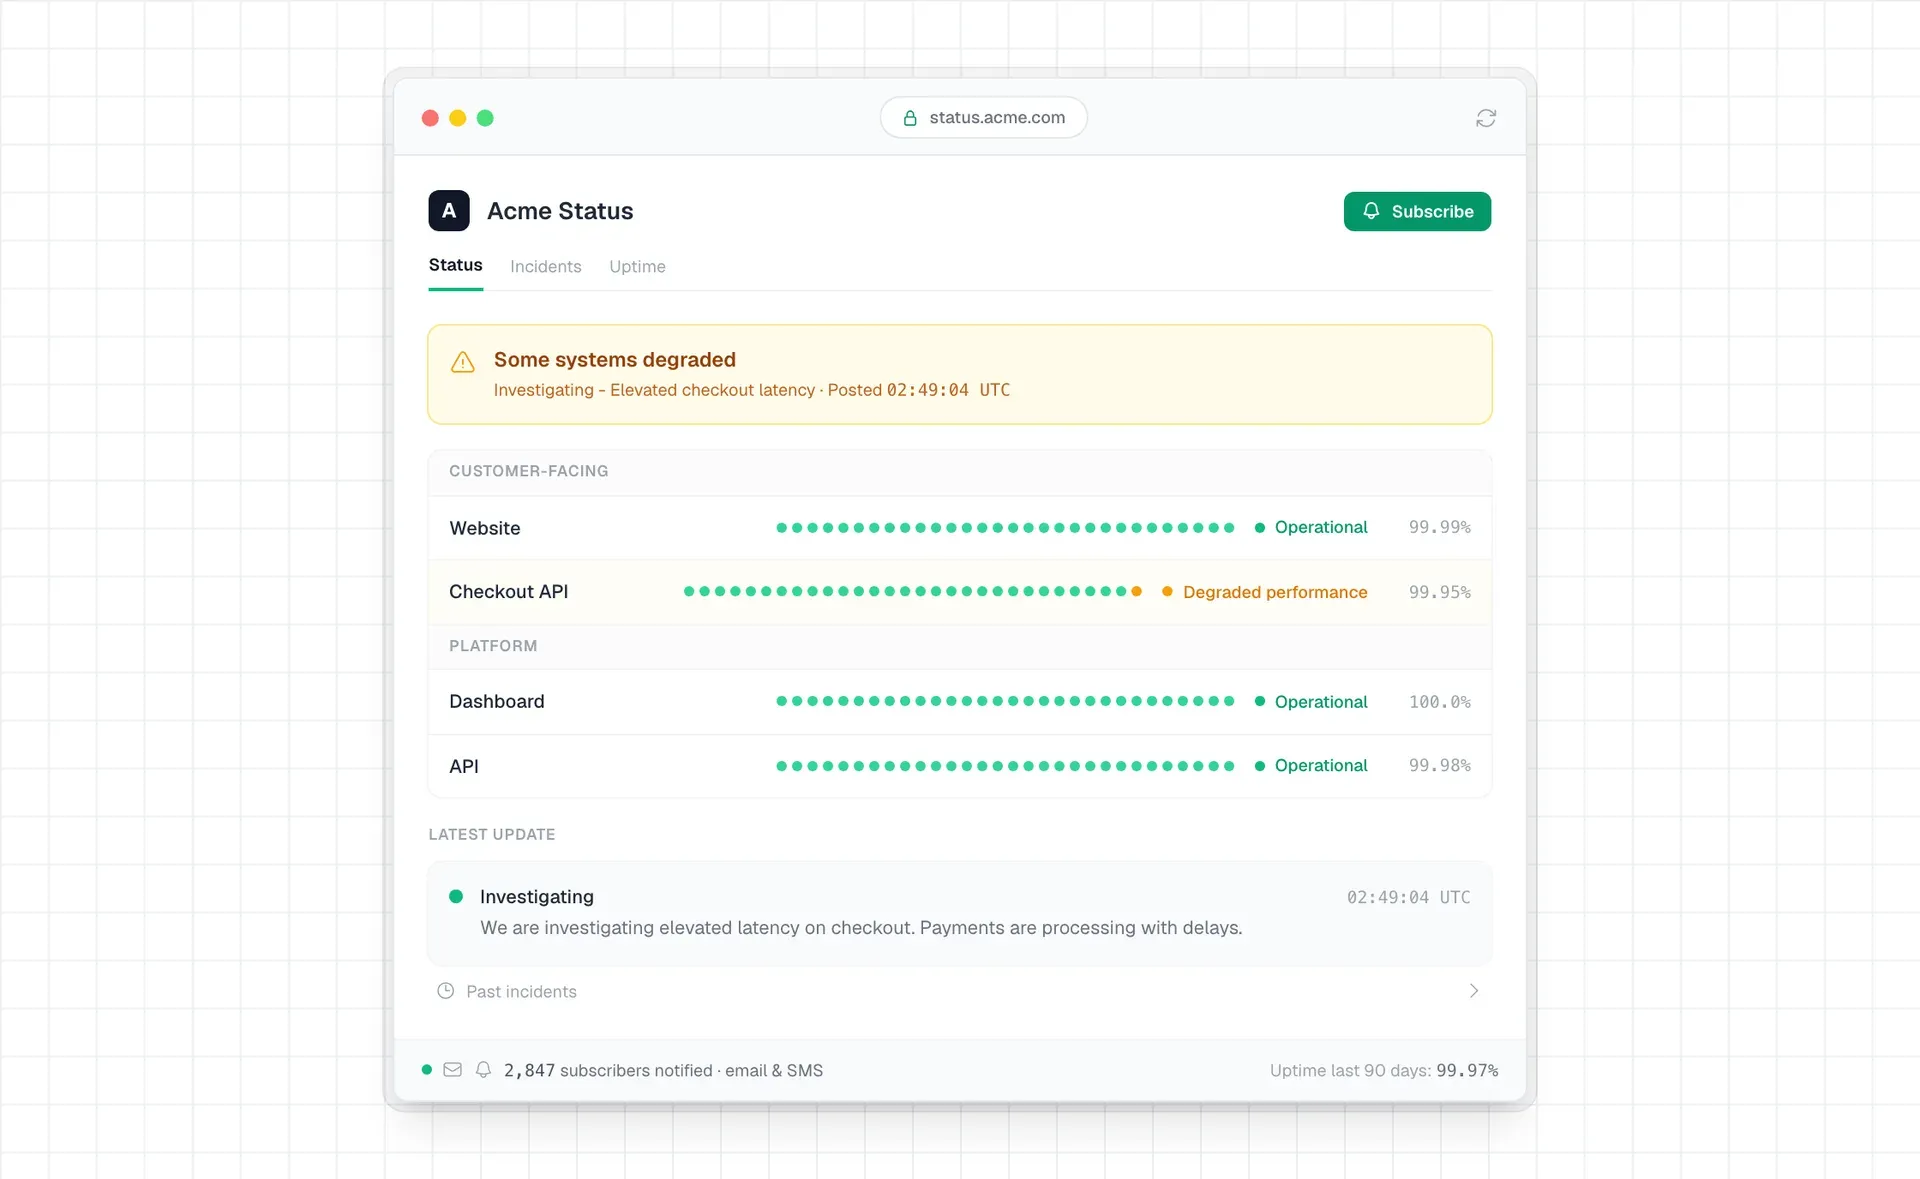
Official OneUptime README image: a sample status page with service groups, uptime history, an investigating update and subscriber notifications.
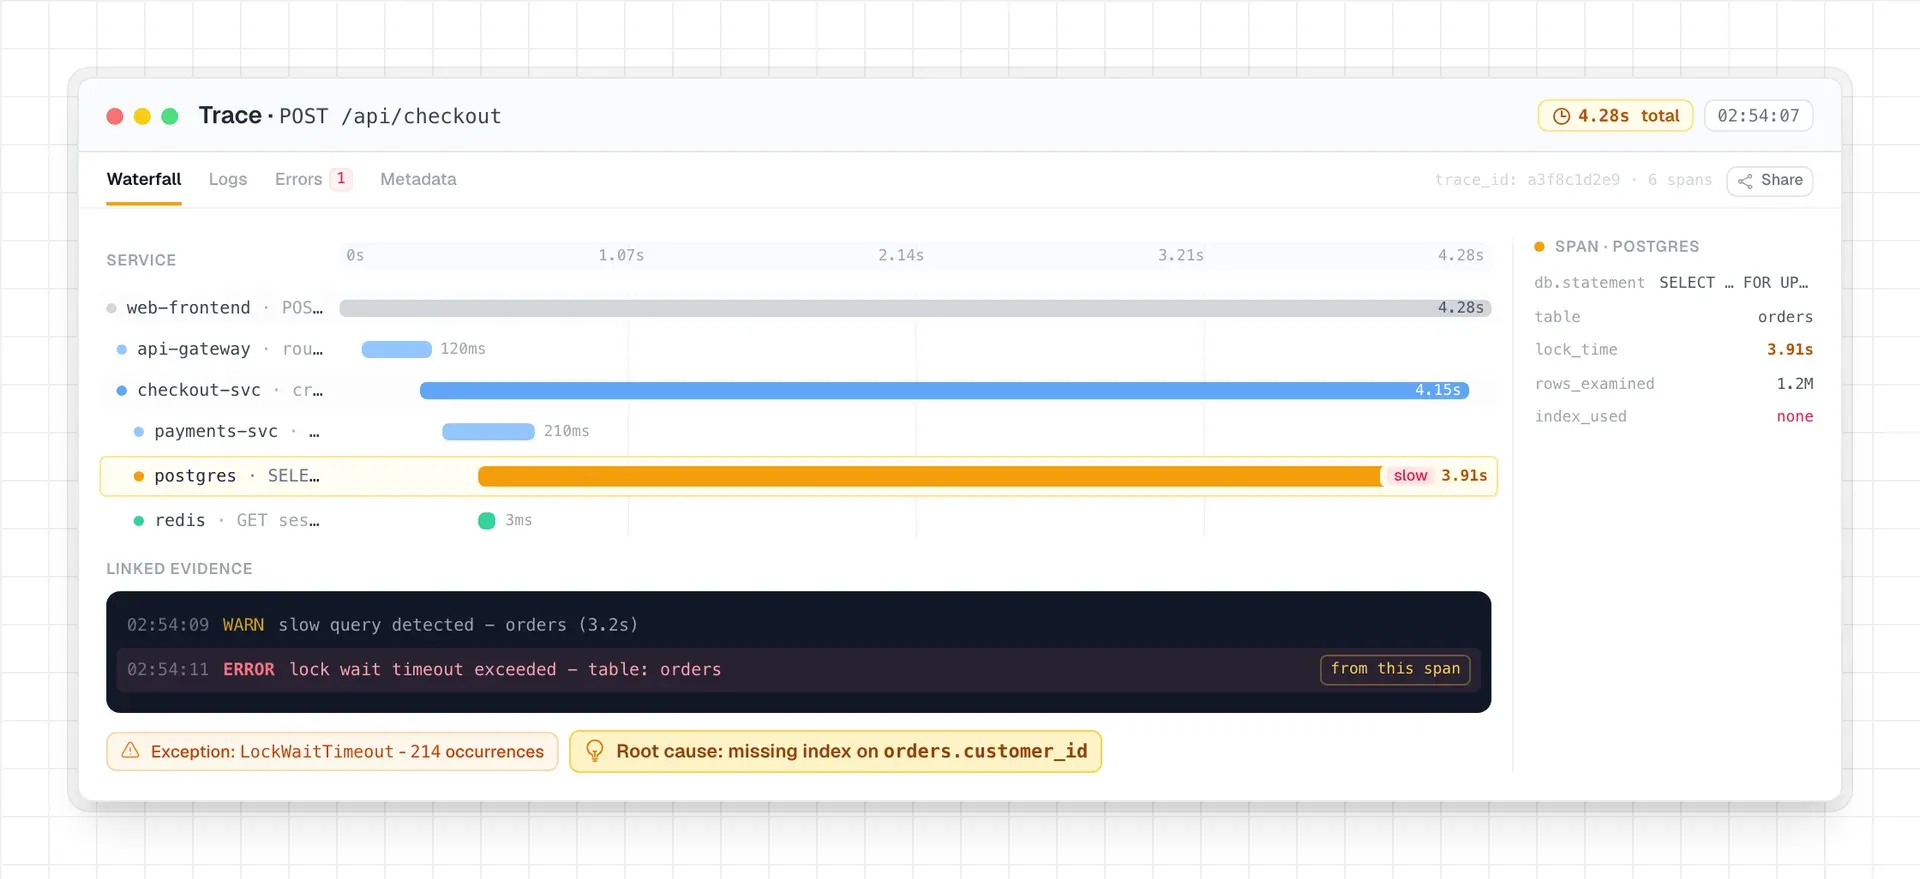
Official OneUptime README image: a distributed trace with per-service spans, a slow PostgreSQL span and linked log lines.
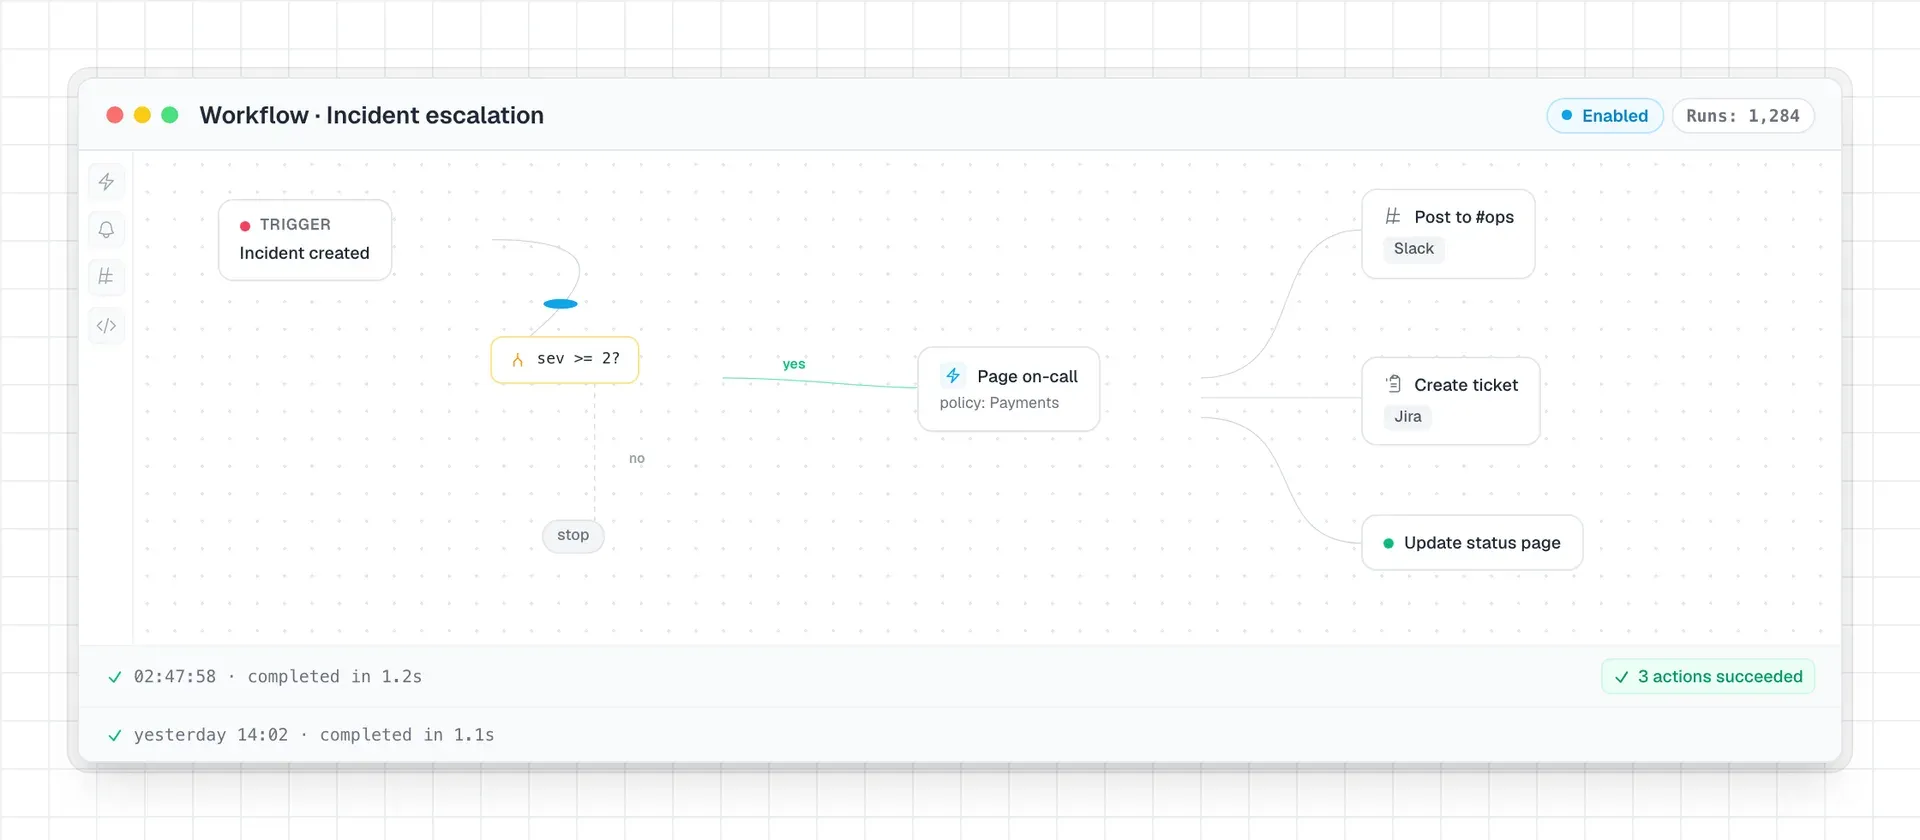
Official OneUptime README image: a no-code workflow that pages on-call and updates Slack, Jira and a status page when an incident is created.
Source: official OneUptime project page.
Key capabilities
- Website, API and network checks Monitors cover websites, APIs, ping, ports, SSL certificates, DNS, DNSSEC, domains, IP addresses and NTP. Checks run from OneUptime probes in several regions or from a custom probe placed inside a private network. The Create Monitor flow starts with Website, API, Ping, Port, SSL Certificate and Incoming Request, and a Test Monitor button runs a check once from a chosen probe before saving.
- Synthetic and custom code monitors Synthetic monitors run browser scripts with Playwright, and custom code monitors run JavaScript checks. Monitor criteria decide when a monitor changes status, declares an incident or creates an alert, with JavaScript expressions and incident or alert templating documented for more specific rules. Monitor secrets keep credentials out of the check definition.
- Heartbeat, email and manual monitors Incoming Request monitors accept heartbeats from cron jobs and webhooks, and incoming email monitors react to messages sent to a monitor address. Manual monitors take a status set by a person, and Probe Status monitors report when a probe disconnects. External status page monitors follow the published status of third-party services.
- Infrastructure monitoring Documented monitor types include servers and hosts, Docker, Docker Swarm, Podman, Kubernetes, VMware, Proxmox, OpenStack, Ceph, storage arrays, SQL and database health, network devices and IoT devices. The infrastructure agent is published with each release as DEB, RPM, APK, Arch Linux and tar.gz packages, as MSI and ZIP files for Windows and as tar.gz archives for macOS, FreeBSD and OpenBSD, on amd64 and arm64.
- Logs, metrics and traces over OpenTelemetry Applications send telemetry over OTLP from any OpenTelemetry SDK or through an OpenTelemetry Collector, authenticated with an ingestion key in the
x-oneuptime-tokenheader. Services are created automatically from theservice.nameattribute, and drop filters and scrub rules act on data as it arrives. The OpenTelemetry guide lists endpoints, size limits and status codes. - Exceptions, profiles, RUM and APM Exception events on spans and exceptions recorded in logs are grouped into issues with stack traces. The platform also stores CPU and memory profiles, real user monitoring data and security events next to logs, metrics and traces. Traces, metrics, logs and profiles can each drive their own monitor type, so telemetry thresholds can open alerts and incidents.
- Dashboards Custom dashboards are built from widgets over telemetry and monitor data, with variables, data sources, playlists and sharing documented separately. Dashboards can be shared publicly, and IP allowlists for public dashboards are an Enterprise Edition or Scale plan feature.
- Incident management Each incident has one timeline with notes, owners, linked alerts, custom states and severities, and public or private postmortem notes. Related alerts and incidents can be grouped into episodes. The incident documentation covers declaring incidents, the feed and postmortems.
- On-call schedules and escalation On-call policies page people level by level through escalation rules, schedules, teams and user overrides until someone acknowledges, and policies can repeat. Each person chooses personal rules for push notification, SMS, phone call, email or chat, and execution logs record every run. The on-call guide also covers calendar feeds, an incoming call policy and readiness checks.
- Notification channels Alerts and pages reach people by phone call, SMS, WhatsApp, email, push notification, Slack, Microsoft Teams and webhooks. On OneUptime Cloud, SMS, WhatsApp messages and calls are billed per message or minute, while push, app, email and webhook alerts are free; a project can connect its own Twilio account instead.
- Status pages A project can run any number of public or private status pages. Each page shows selected monitors as resources, grouped into sections, and can display incidents, episodes, announcements, scheduled maintenance and uptime history. Access can be open, restricted to private users, SAML SSO or OIDC, or protected by a password, and subscribers follow changes by email, SMS, Slack, Microsoft Teams or webhook. Custom domains use a CNAME record with a free certificate, as described in the status page documentation.
- Workflows and runbooks A drag-and-drop workflow builder connects triggers such as a new incident to actions in Slack, Jira, webhooks or custom code, and runbooks run response steps automatically. The workflow documentation describes the builder. Cloud plans list monthly workflow run quotas: 500 on Growth and 2,000 on Scale.
- OneUptime AI OneUptime AI investigates new incidents and alerts and posts a root cause analysis with citations. When fixing is enabled it can open a pull request with a proposed fix, using the GitHub or GitLab integration, for the team to review. On the Growth plan and above, a project can connect its own LLM provider; otherwise tokens are billed per 1,000. Details are in the AI SRE documentation.
- MCP server for AI clients Every instance exposes a Model Context Protocol server at
/mcpover the streamable HTTP transport, athttps://oneuptime.com/mcpfor the cloud. Claude, Cursor, VS Code with GitHub Copilot and other MCP clients sign in as a user or use an API key, and the tools cover monitors, incidents, alerts, on-call, status pages, maintenance and read-only telemetry queries. On OneUptime Cloud it needs the Growth plan or higher, per the MCP server guide. - API, CLI, Terraform and Crossplane A REST API documented in the API reference manages projects, monitors, status pages and on-call. A command-line tool supports scripting and several output formats, and Terraform and Crossplane manage monitors, status pages and on-call as code. API access on the cloud starts with the Growth plan.
- Integrations and migration guides The documentation lists integrations with Jira, ServiceNow, PagerDuty, Opsgenie, Datadog, Grafana, New Relic, Prometheus Alertmanager, Splunk, Zabbix, GitHub, GitLab, Discord, Telegram, Okta, Microsoft Entra ID, Vercel and several security platforms. Migration guides describe moving from Atlassian Statuspage, Better Stack, Grafana OnCall, incident.io, Opsgenie, PagerDuty, Pingdom, Splunk On-Call, StatusCake, Uptime Kuma and UptimeRobot.
- OneUptime On-Call mobile app and desktop install OneUptime On-Call for iPhone, iPad and Android receives on-call pages as push notifications that can ring through silent mode, and lets responders acknowledge or resolve incidents and alerts. It requires iOS 16.4 or later or Android 7.0 or later and comes from the App Store, Google Play or a GitHub APK. On Windows, macOS and Linux the dashboard installs from Edge, Chrome or Safari as a desktop web app.
- Self-hosting with Docker Compose The Docker Compose install clones the
releasebranch, copiesconfig.example.envtoconfig.env, setsHOSTand runsnpm start, which generates random secrets and starts every container. The documented recommendation is 16 GB of memory, 8 cores and 400 GB of disk, with a homelab minimum of 8 GB, 4 cores and 20 GB, on amd64 or arm64 Linux with Docker Compose v2, Git and Node.js. The first account created becomes the instance admin. - Self-hosting on Kubernetes with Helm The Helm chart installs with
helm repo add oneuptime https://helm-chart.oneuptime.com/andhelm install, settinghostto the public address. The sizing guide notes that chart defaults are not production sizing, gives starting tiers and a ClickHouse storage formula based on daily telemetry volume and retention, and states that OneUptime does not need object storage to run. Air-gapped installation and cloud marketplace deployments have their own guides. - OneUptime Cloud plans The pricing page lists a Free plan with one status page, 100 subscribers, incident management and best-effort support, a Growth plan at $22 with unlimited status pages, on-call rotation, integrations and API access, a Scale plan at $99 adding SSO, unlimited teams and advanced access control, and a custom-priced Enterprise plan. Active monitors start at $1 per monitor per month and telemetry at $0.10 per GB ingested with 15-day retention. OneUptime Cloud is also sold through AWS Marketplace and Microsoft Marketplace at the same prices.
Where OneUptime fits
Uptime monitoring with public status pages
A team creates Website, API, Ping, Port or SSL Certificate monitors, runs them from several probe regions, and adds those monitors as resources on a status page. When criteria mark a monitor degraded or offline, OneUptime can declare an incident that appears on the page and notifies subscribers by email, SMS, Slack, Microsoft Teams or webhook. Scheduled maintenance events are announced on the same page. Similar projects in this directory include Uptime Kuma, Checkmate and Cachet.
On-call paging and escalation
Incidents, alerts and episodes run on-call policies whose escalation rules page whoever is on call in a schedule, the members of a team or named people. If nobody acknowledges within a rule's wait, the next rule pages, and acknowledging or resolving stops every running policy. Responders use the OneUptime On-Call mobile app, phone calls, SMS, email or chat, and the on-call documentation describes overrides for people who are away.
Application observability with OpenTelemetry
Services export logs, metrics and traces over OTLP from an OpenTelemetry SDK or Collector with an ingestion key. OneUptime lists each service, groups exceptions into issues, shows traces as waterfalls linked to logs, and lets logs, metrics or traces monitors turn thresholds into alerts. On OneUptime Cloud, ingestion is billed per GB and Free plan projects need a payment method before sending telemetry. SigNoz and Uptrace are other OpenTelemetry-based platforms listed here.
Infrastructure and Kubernetes monitoring
The infrastructure agent reports server metrics from Linux, Windows, macOS, FreeBSD and OpenBSD hosts. Dedicated monitor types follow Kubernetes clusters, Docker and Podman hosts, Docker Swarm, VMware, Proxmox, OpenStack, Ceph, databases, storage arrays and network devices, and release assets include separate Kubernetes agent, log tailer and cost agent images.
Automated incident response
Workflows react to events such as a new incident and run steps like posting to Slack, creating a Jira ticket or updating a status page. Runbooks execute response steps, and OneUptime AI posts a root cause analysis on new incidents and can open a fix pull request when fixing is enabled. MCP clients such as Claude or Cursor can query telemetry, acknowledge alerts or create monitors through the MCP server.
Running OneUptime on your own infrastructure
A single Linux server runs the full Community Edition with Docker Compose, while Kubernetes installations use the Helm chart with PostgreSQL, ClickHouse and Valkey sized separately according to the sizing guide. Switching to the Enterprise image changes one setting and adds the ee/ modules under the Enterprise License. Monitoring, incidents, on-call, status pages, telemetry, AI features, the API and Terraform are included in both editions.
Install
git clone --depth 1 --single-branch --branch release https://github.com/OneUptime/oneuptime.git && cd oneuptime && cp config.example.env config.env && npm startReviews of OneUptime
Be the first to share your experience with OneUptime.
Write a review
Loading review form…
Alternatives to OneUptime
 Better StackBetter Stack is a hosted platform for uptime monitoring, on-call alerting, incident management, status pages, logs, traces, metrics, error tracking and an AI SRE agent, with a free tier and usage-based telemetry pricing.
 Uptime KumaUptime Kuma is a self-hosted monitoring tool that checks HTTP, TCP, ping, DNS and Docker targets at 20-second intervals and publishes status pages.
 CheckmateCheckmate by Bluewave Labs is a self-hosted, AGPL-3.0 monitoring app for HTTP, ping, port, DNS, Docker, gRPC, WebSocket and heartbeat checks, server metrics via the Capture agent, PageSpeed audits, alerts and status pages.