

What is Checkmate?
Checkmate is an open-source, self-hosted uptime and infrastructure monitoring application developed by Bluewave Labs and published under the AGPL-3.0 license. According to the README, it checks whether servers and websites are reachable and responsive, stores response times, opens and resolves incidents, sends notifications and publishes status pages. The project website at checkmate.so describes uptime, server, container and PageSpeed monitoring plus status pages from one login, with no monitor limits and no paid tier.
The application is a Node.js backend with a React and MUI frontend, Recharts for charts and MongoDB for storage. Since the move to an all-in-one image, the reference Docker Compose file starts two services: ghcr.io/bluewave-labs/checkmate, which serves the API and the web client on port 52345, and a separate MongoDB container. Required settings are DB_CONNECTION_STRING, JWT_SECRET and CLIENT_HOST. The README notes that the Helm chart for Kubernetes still deploys the legacy client, backend and MongoDB images pinned at v3.8.1, and lists one-click templates on hosts such as PikaPods, RepoCloud, Coolify, Elestio and Easypanel.
Server metrics such as CPU, memory, disk, temperature and network come from a separate agent, Capture, written in Go and available for Linux, Windows, macOS and Raspberry Pi. Capture is optional for uptime checks. For larger installations, the QUEUE_MODE setting runs dedicated worker nodes that share the check load through MongoDB; the README states that a single deployment monitors more than 1,600 servers in production and that worker nodes extend this beyond 5,000.
The latest release is v3.13.1, published on October 22, 2026, which adds a count of monitors by type to the anonymous telemetry. The preceding v3.13.0 added Docker container alerts, Capture-backed Docker monitors, an optional egress self-check, incident history on public status pages, custom check intervals with a 10 second minimum and JSON logging, and requires Node 24 for source installs. Since v3.13.0, each installation sends one anonymous heartbeat every 24 hours with an instance ID, version, deployment type, queue mode, Node.js version, OS and architecture; TELEMETRY_ENABLED=false turns it off.
The interface is translated into 19 languages, and community support runs through Discord and GitHub Discussions. A public demo is available at demo.checkmate.so. Similar self-hosted projects on iThub include Uptime Kuma, OneUptime and Beszel.
Checkmate screenshots
Explore the interface. Open a screenshot to view it at full size.
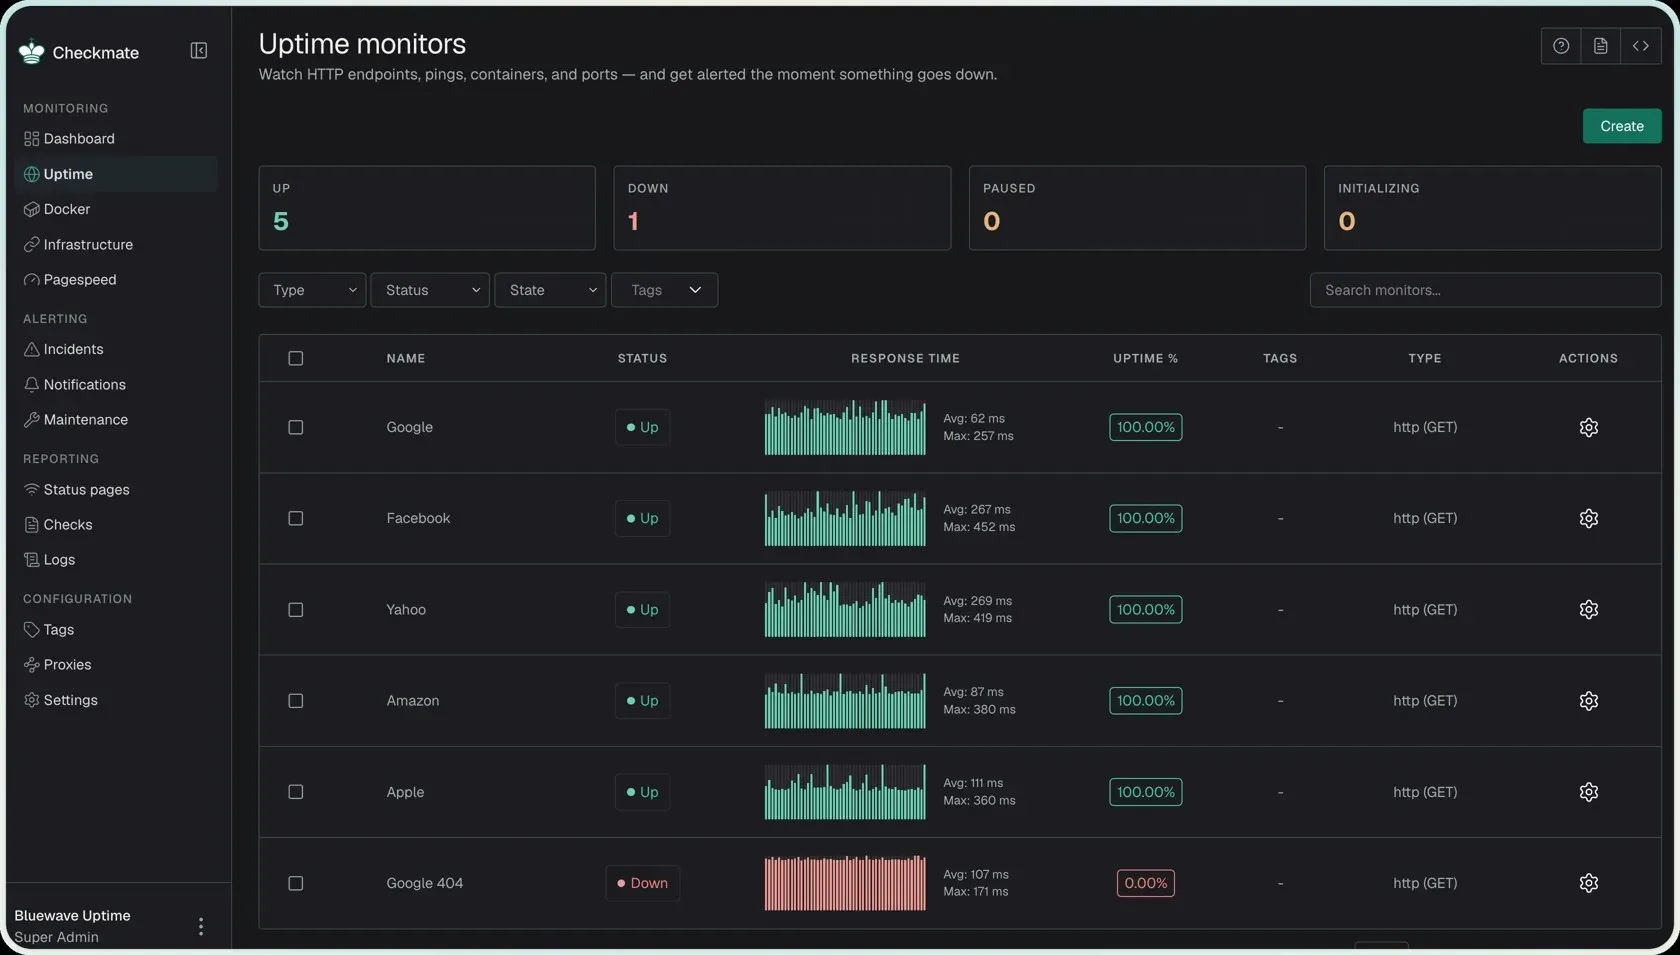
Uptime monitors list with up and down counts, filters, response time history and uptime per monitor.
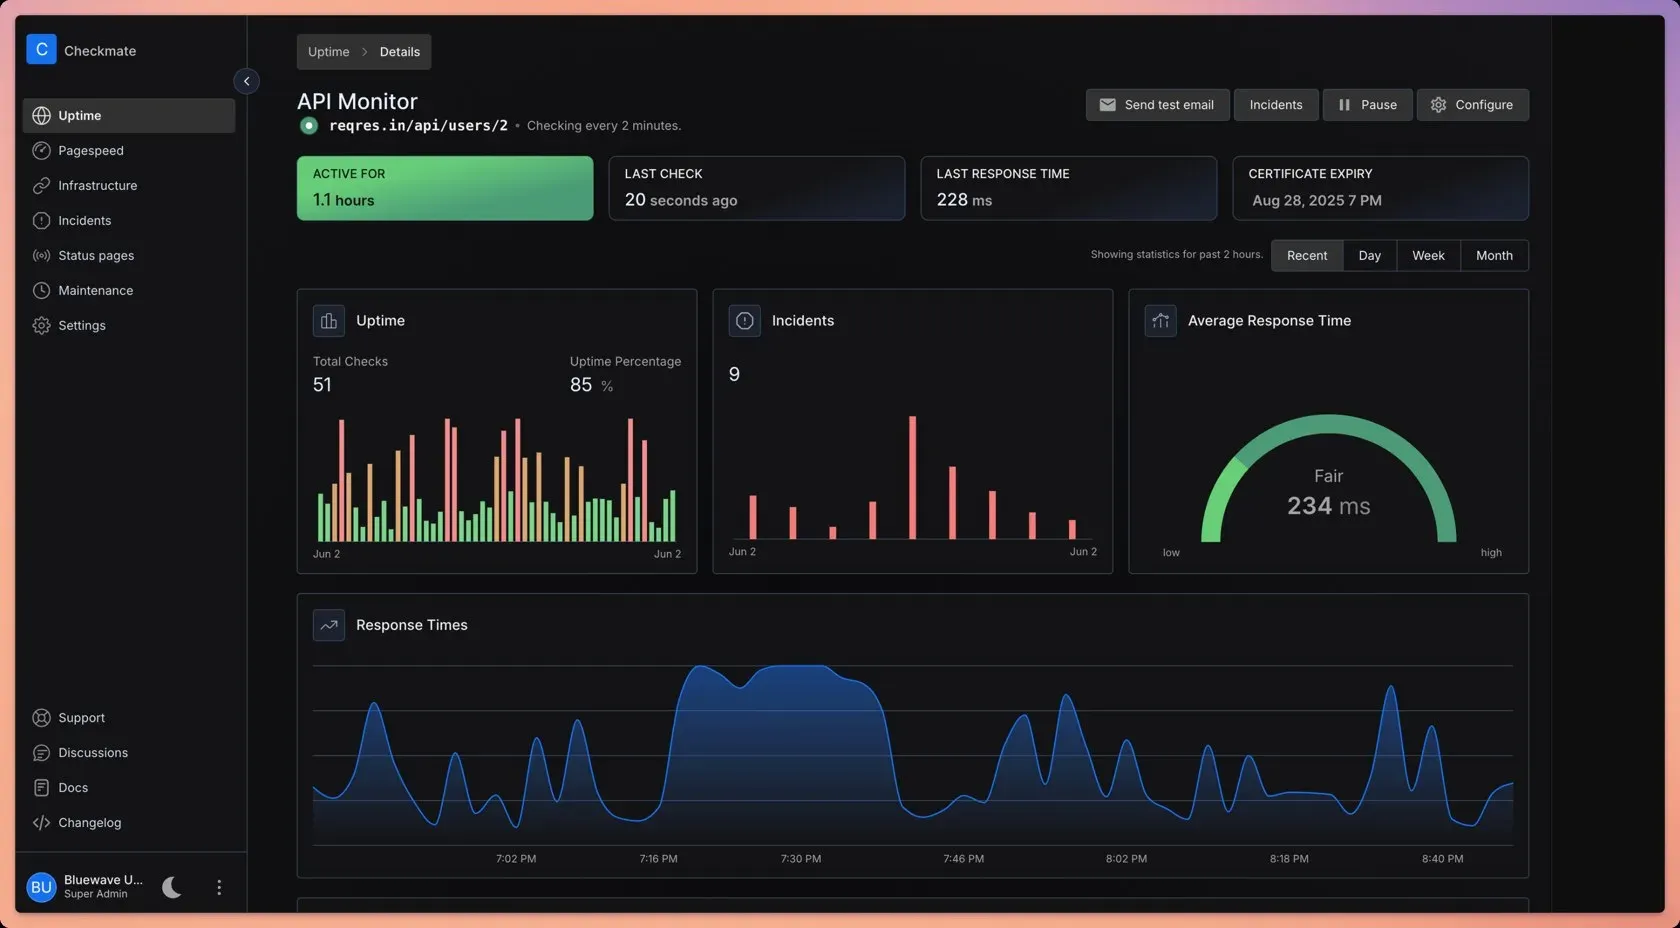
Monitor detail view with uptime checks, incidents, an average response time gauge and certificate expiry.
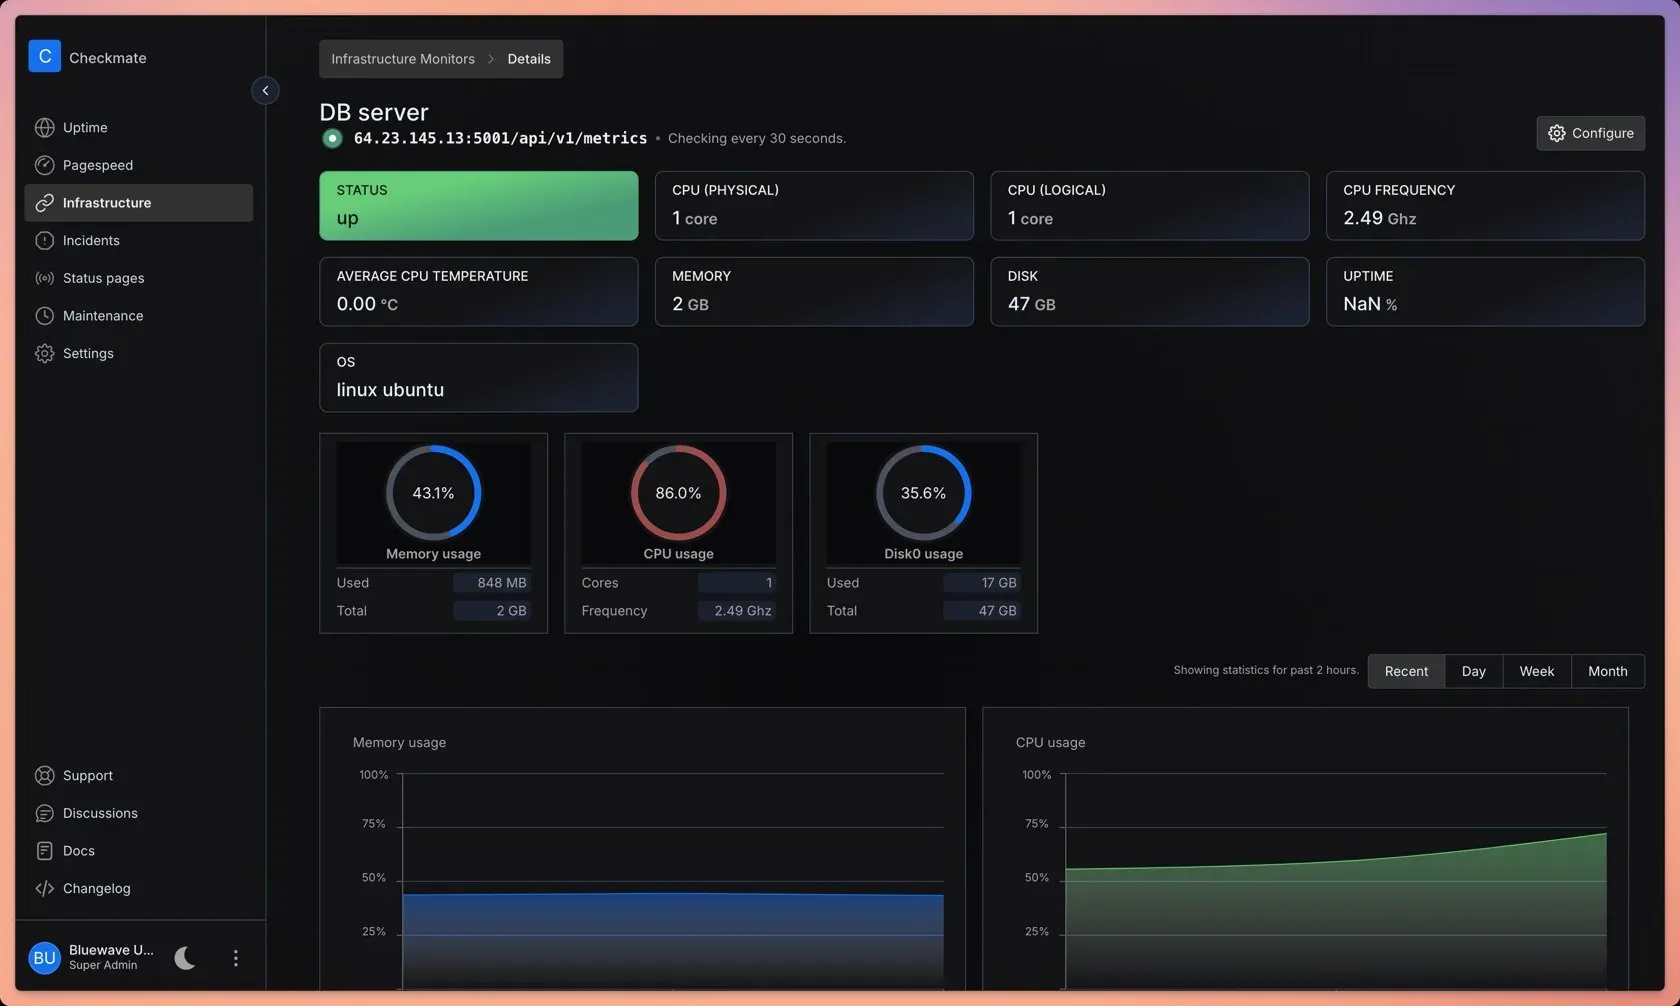
Infrastructure monitor for a server reporting through the Capture agent, with CPU, memory and disk gauges.
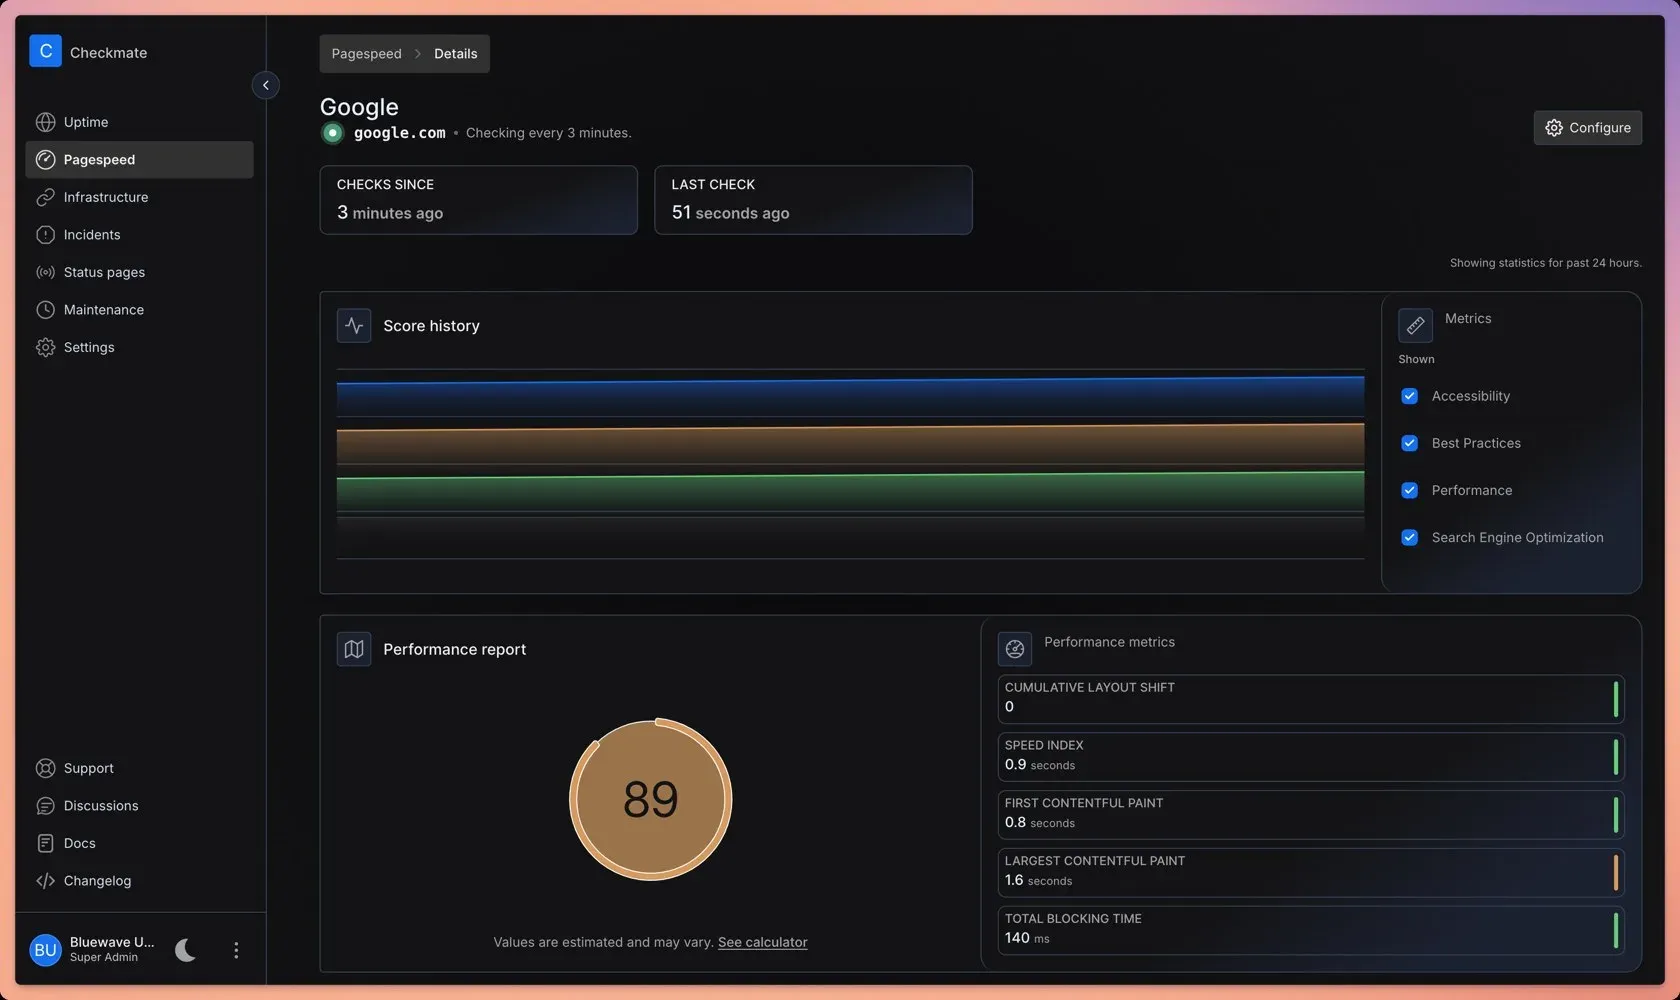
PageSpeed monitor with Lighthouse score history, a performance score and Core Web Vitals metrics.
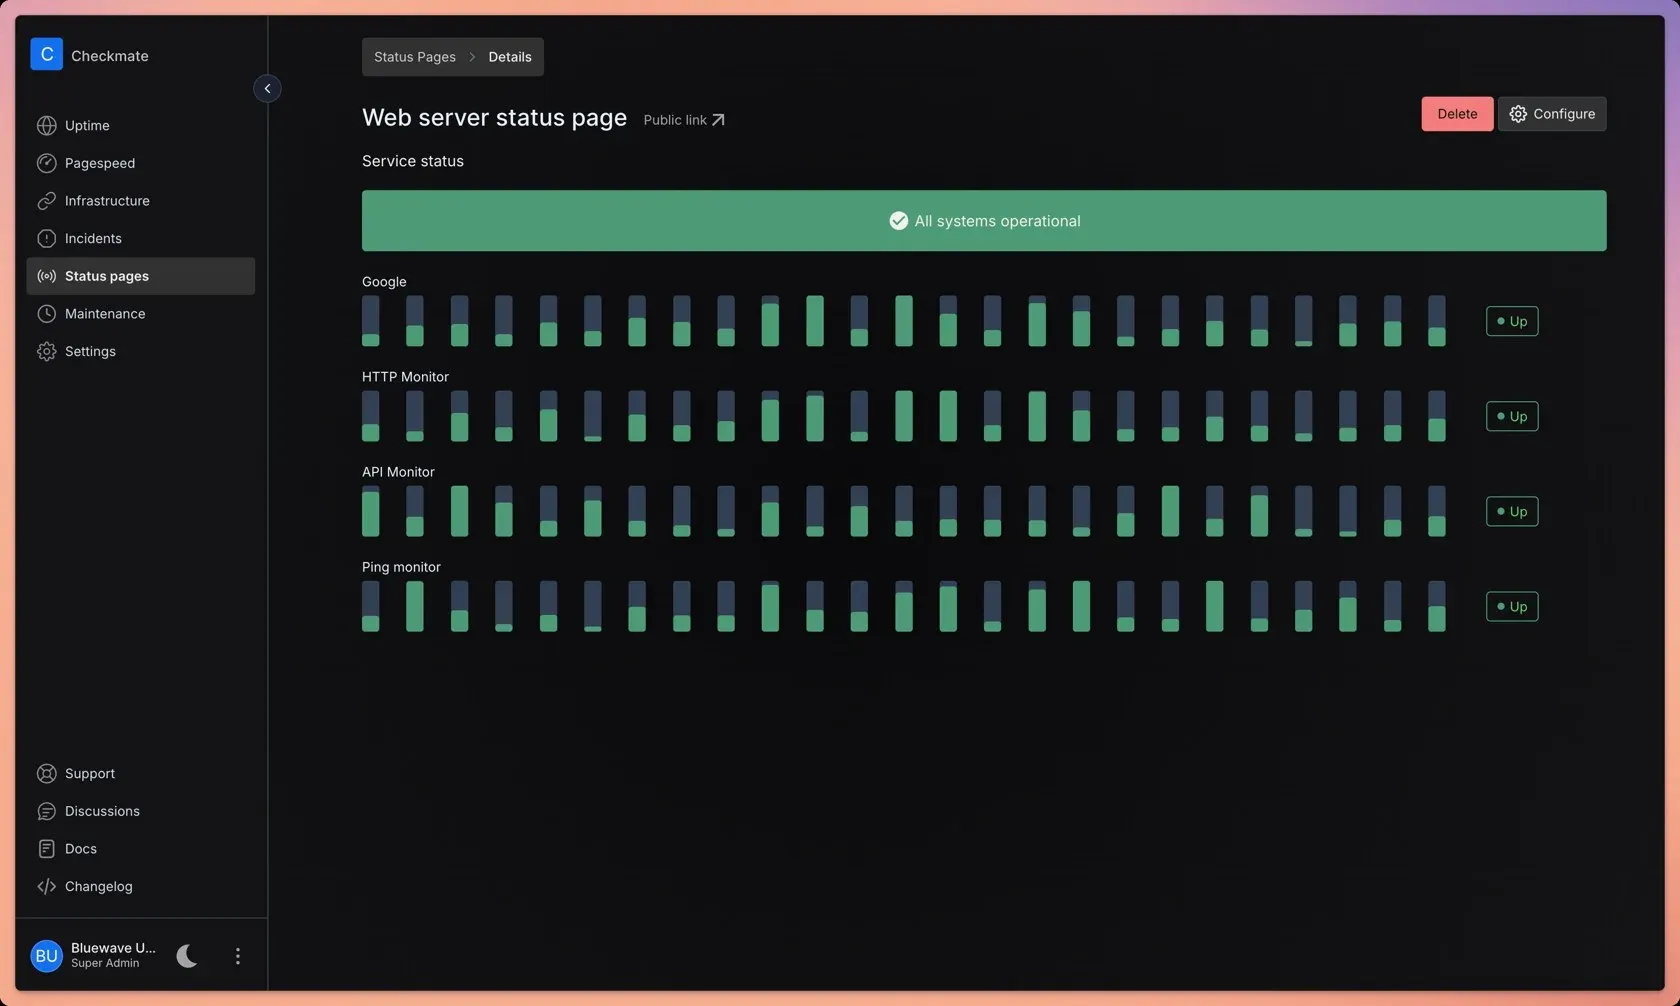
Status page view with the overall service state and uptime bars for HTTP, API and ping monitors.
Source: official Checkmate project page.
Key capabilities
- HTTP and API monitors HTTP monitors check URLs and APIs, follow redirects with cookies and can match content in the response, including JSON queries through a
jsonPath. WhenjsonPathis empty, content matching runs against the raw body. The HTTP monitor guide covers the options. - Ping, port, DNS, gRPC and WebSocket checks Besides HTTP, monitors cover ICMP ping (including IPv6 addresses), TCP ports, DNS records, gRPC health checks and WebSocket endpoints. Check intervals are configurable with a 10 second minimum since v3.13.0.
- Game server monitors The game server monitor type queries game servers directly; the website states that more than 100 game types are supported.
- SSL certificate and domain expiry HTTP monitors track SSL certificate expiry, and the website lists domain expiry monitoring. Release notes for v3.13.0 mention fixes for certificate checks on non-default ports and for domain expiry on .tr domains.
- Global checks The website lists HTTP, ping and TCP checks from six continents through the GlobalPing network, in addition to checks run from the Checkmate server itself.
- Heartbeat monitors Heartbeat monitors are passive: a cron job or backup script calls
/api/v1/heartbeat/<pingKey>/<slug>, optionally with an exit code, duration and message, and the monitor goes down if no ping arrives within its window. Addingcreate=truecreates the monitor on first ping, limited to 20 such requests per hour per key. - Docker monitors A Docker monitor reports on every container on a host through the local socket, a remote daemon over mutual TLS on port 2376 or a Capture agent. Direct monitors record state, health, CPU, memory, restarts, ports and mounts, and can store the last 200 log lines per container for 7 days. TLS client keys are encrypted with
ENCRYPTION_KEY. - Infrastructure monitoring with Capture With the Capture agent installed on a server, Checkmate shows CPU, memory, disk, temperature and network metrics, with thresholds that raise alerts. Disk monitoring can be limited to selected mount points.
- PageSpeed monitoring PageSpeed monitors run scheduled Lighthouse audits and record performance, accessibility, best practices and SEO scores together with Core Web Vitals such as Largest Contentful Paint, Cumulative Layout Shift and Total Blocking Time.
- Incidents and monitor lifecycle Each check result is stored and evaluated against a status change threshold. When the state changes between up, down or breached, an incident is created or resolved and notifications fire. New monitors start as initializing, and monitors in a maintenance window are not checked.
- Notifications Alerts go to email, webhooks, Discord, Slack, PagerDuty, Matrix, Rocket.Chat, Microsoft Teams, Telegram, Pushover, ntfy, SignalGrid and Twilio SMS, according to the README feature list.
- Status pages Public status pages show selected monitors with recent uptime bars and an overall service status, in five themes. Since v3.13.0 visitors can open incident history by clicking a day. The status page guide describes setup.
- Scheduled maintenance Maintenance windows pause checks and alerts for selected monitors during planned work, and monitors return to initializing when the window ends.
- Teams and roles Team members are invited by email, and API routes enforce user, admin and superadmin roles; creating monitors requires admin or higher, according to the API reference.
- REST API The REST API is served at
/api/v1and uses JWT bearer tokens obtained from the login endpoint, with a default lifetime of 99 days set byTOKEN_TTL. Each server hosts a Swagger UI at/api-docs, and the API reference describes the OpenAPI file shipped with the server. - Health and metrics endpoints Processes that run the job worker expose
/livez,/readyzand/metricsonHEALTH_PORT, 52346 by default. - Docker Compose installation The installation guide starts from the reference Compose file: download it, set
JWT_SECRETand rundocker compose up -d, then open port 52345. TLS is handled by a reverse proxy such as Caddy, Traefik or nginx in front of the app. - Kubernetes and source installs A Helm chart in the repository deploys the legacy split images pinned at v3.8.1. Source installs require Node 24 and npm 11 since v3.13.0.
Where Checkmate fits
Website and API uptime monitoring
An HTTP monitor is created for each website or API endpoint with an interval, expected content or JSON value and certificate expiry tracking. The uptime list shows status, response time history and uptime percentage per monitor, and the detail view shows checks, incidents and average response time over day, week and month ranges.
Server health with the Capture agent
Capture is installed on each Linux, Windows, macOS or Raspberry Pi host and exposes a metrics endpoint that Checkmate polls. The infrastructure view shows CPU, memory, disk and temperature, and thresholds on these values open incidents and send alerts when they are breached.
Container monitoring
A Docker monitor pointed at the local socket, a TLS-protected remote daemon or a Capture endpoint lists every container on the host with its state and health. Since v3.13.0, stopped or unhealthy containers trigger alerts, and direct monitors can keep recent container logs. The Docker monitor documentation covers socket permissions and TLS setup.
Cron job and backup monitoring
A heartbeat monitor receives a ping from a scheduled job at the end of each run, optionally with the exit code and duration. If the job fails or does not run within its window, the monitor goes down and an incident is opened, as described in the README section on heartbeat monitors.
Public status pages
Teams publish a status page that groups selected monitors, shows an overall service state and recent uptime bars, and links to incident history. Scheduled maintenance windows suppress checks and alerts for planned work so that planned downtime does not open incidents.
Front-end performance tracking
PageSpeed monitors run Lighthouse on a schedule against chosen URLs and keep a score history for performance, accessibility, best practices and SEO, with individual Core Web Vitals metrics, as described in the PageSpeed guide.
Reviews of Checkmate
Be the first to share your experience with Checkmate.
Write a review
Loading review form…
Alternatives to Checkmate
 Uptime KumaUptime Kuma is a self-hosted monitoring tool that checks HTTP, TCP, ping, DNS and Docker targets at 20-second intervals and publishes status pages.
 OneUptimeOneUptime is an open-source observability platform from HackerBay, Inc. that combines uptime and infrastructure monitoring, status pages, incident management, on-call paging and OpenTelemetry logs, metrics and traces, as a cloud service or self-hosted.
 Better StackBetter Stack is a hosted platform for uptime monitoring, on-call alerting, incident management, status pages, logs, traces, metrics, error tracking and an AI SRE agent, with a free tier and usage-based telemetry pricing.