

What is Telegraf?
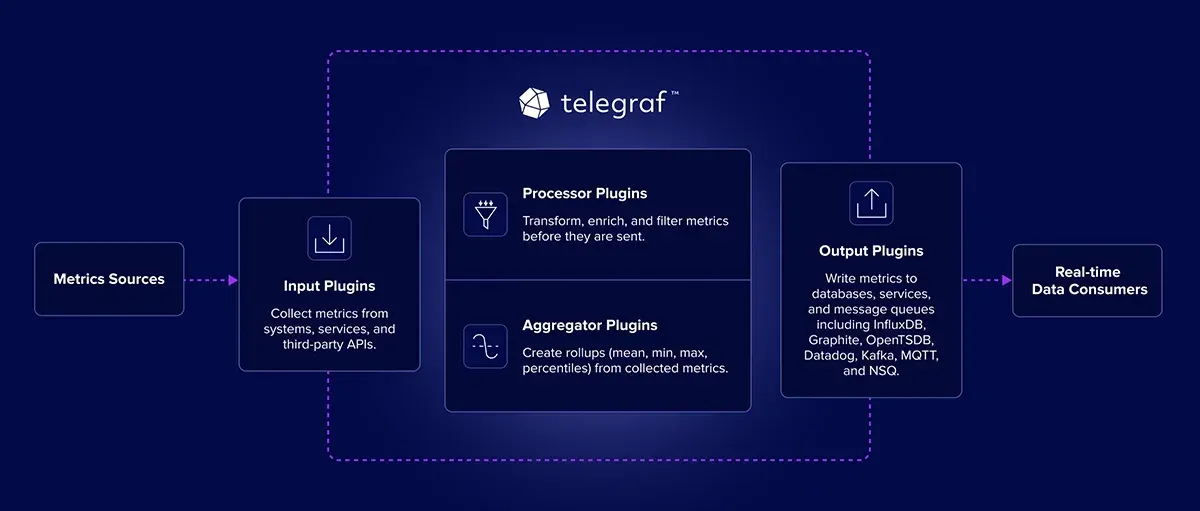
Telegraf is an agent for collecting, processing, aggregating and writing metrics, logs and other data, developed by InfluxData and its community. The official documentation describes it as a plugin-driven server agent with four plugin categories: input, processor, aggregator and output. The repository README states that it offers over 300 plugins covering system monitoring, cloud services and message passing, and that it has received contributions from more than 1,200 contributors. Telegraf is written in Go, compiles into a standalone static binary without external dependencies and is configured with TOML files.
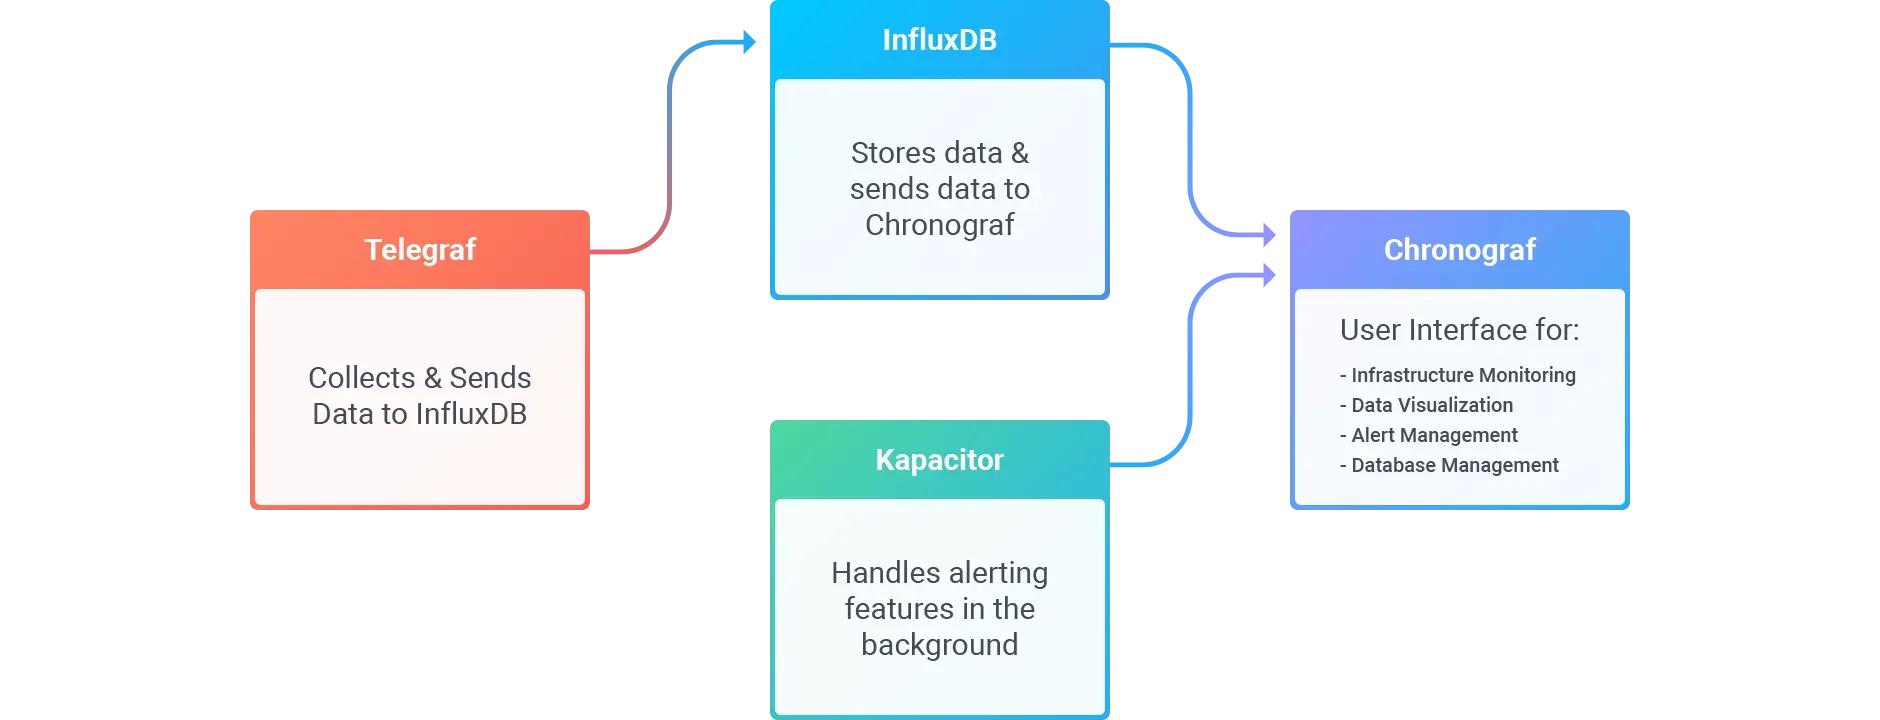
A Telegraf agent reads a TOML configuration listing the plugins to use, collects data from the inputs at each collection interval, passes it through processors and aggregators, and sends it to the outputs at each flush interval. Data is handled internally as metrics with a measurement name, tags, fields and a timestamp, and parser and serializer plugins convert between that model and formats such as JSON, CSV, InfluxDB line protocol, Prometheus and OpenMetrics. Telegraf can write to InfluxDB but is not tied to it: outputs include Prometheus, Kafka, MQTT, Elasticsearch, OpenSearch, Loki, Datadog, cloud monitoring services and SQL databases.
InfluxData publishes binaries for many architectures on its downloads page, DEB and RPM packages from its Linux repository, and Debian- and Alpine-based images as a Docker Official Image covering the last three minor releases. The install guide also lists a Homebrew formula (built by Homebrew with CGO, so it differs from the official binaries), a community-supported Helm chart, nightly builds, building from source with Go and GNU make, and a custom builder that compiles a reduced binary with only the plugins a configuration uses. The documentation lists Linux, macOS, Windows and FreeBSD as supported operating systems, for OS releases under the vendor's general support.
According to the release policy, Telegraf ships four minor releases a year, in March, June, September and December, with two to four bug fix releases every three weeks in between, and follows semantic versioning. The latest release is v1.40.3, published on November 2, 2026, a bug fix release covering the disk buffer, proxy authentication over HTTPS, Docker log streams, OPC UA listener limits, the Elasticsearch, MQTT, Parquet and PostgreSQL outputs and the Prometheus serializers. Version 1.40.0 (September 7, 2026) added the inputs.fritzbox_smarthome and outputs.zerobus plugins, removed the deprecated outputs.amon, inputs.sflow and inputs.aerospike plugins and moved to Go 1.27.
The Telegraf agent is licensed under the MIT License. InfluxData also offers Telegraf Controller, a separate application for managing configurations and monitoring agent fleets, which runs in a free tier of 20 configurations and 100 reporting agents without a license. Telegraf Enterprise is the commercial package that raises those limits, unlocks high availability, LDAP and OIDC authentication, audit logging and security advisories in Controller, and adds an InfluxData support contract for the agent and Controller; pricing is handled by InfluxData sales. Related listings on iThub include Vector and Prometheus.
Key capabilities
- Input plugins Input plugins collect data from the host and from external systems. The README groups them into devices (OPC UA, Modbus), logs (File, Tail, Directory Monitor), messaging (AMQP, Kafka, MQTT), monitoring (OpenTelemetry, Prometheus), networking (Cisco Telemetry MDT, gNMI), system monitoring (CPU, memory, disk, network, SMART, Docker, NVIDIA SMI), universal inputs (Exec, HTTP, HTTP Listener, SNMP, SQL) and Windows sources. The input plugin reference documents each plugin's options and metrics.
- Output plugins Outputs write metrics to databases, services and queues. The repository includes outputs for InfluxDB v1, v2 and v3, Prometheus client, Kafka, MQTT, NATS, NSQ, AMQP, Elasticsearch, OpenSearch, Loki, Graylog, Datadog, New Relic, Dynatrace, CloudWatch, Azure Monitor, Azure Data Explorer, Google BigQuery and Cloud Pub/Sub, PostgreSQL, SQL, Parquet files, OpenTelemetry and Zabbix, among others. Outputs buffer metrics between flushes, and the agent also offers a disk buffer.
- Processor plugins Processors transform metrics in flight. Available processors include regex, rename, converter, enum, strings, filter, dedup, lookup, override, defaults, tag_limit, topk, scale, round, reverse_dns, snmp_lookup, aws_ec2 and template, plus a Starlark processor for custom logic written in a Python-like language. Processors run in configured order before metrics reach aggregators and outputs.
- Aggregator plugins Aggregators compute rollups over a period: basicstats (mean, min, max and others), minmax, histogram, quantile, derivative, valuecounter, merge and final, and a Starlark aggregator for custom calculations. Version 1.40.0 added a configuration setting to skip processors before aggregators.
- Parsers and serializers Parser plugins read incoming data in formats including JSON, JSON v2, CSV, InfluxDB line protocol, Graphite, Grok, logfmt, XPath (for XML, JSON, MessagePack and Protocol Buffers), Avro, Parquet, Prometheus, Prometheus remote write, OpenMetrics, collectd, Dropwizard and Nagios. Serializers write InfluxDB line protocol, JSON, CSV, Graphite, Carbon2, CloudEvents, MessagePack, Prometheus, Prometheus remote write, Splunk metrics, Wavefront or a template-defined format.
- Configuration in TOML Telegraf uses TOML configuration files with agent settings, global tags and one section per plugin instance. The configuration documentation covers environment variable substitution, metric filtering by name, tags and fields, common plugin options, TLS settings and labels and selectors for enabling plugins per agent.
telegraf config creategenerates a sample file andtelegraf config migraterewrites deprecated options to their replacements. - Secret stores Credentials can be kept out of configuration files with secret store plugins for the OS keyring, HashiCorp Vault, Docker secrets, systemd credentials, Google Cloud, an HTTP endpoint, JOSE-encrypted files and OAuth2 token sources. The
telegraf secretscommands list, get, set and, since 1.40.0, remove secrets in a store. - External plugins and execd Programs written in any language can act as plugins through the execd input, processor and output plugins, which exchange data with a long-running process over stdin and stdout. The external plugins guide describes the execd shim for building such plugins in Go outside the main repository.
- Industrial and IoT protocols For operational technology, inputs include OPC UA and an OPC UA listener for subscriptions, Modbus, Siemens S7 (s7comm), MQTT and Kafka consumers. Version 1.40.3 made the OPC UA listener respect a server's limit on monitored items per call and made s7comm reconnect after a failed handshake.
- Network telemetry Network devices can be polled with SNMP, including an SNMP lookup processor for interface names, or stream telemetry through gNMI and Cisco Telemetry MDT. Version 1.40.0 changed several Cisco MDT behaviours, such as honouring configured aliases and fixing row numbering for table data, which can change metric names for existing setups.
- Windows monitoring On Windows, inputs read the Event Log, Windows Management Instrumentation and Performance Counters, and the agent can run as a Windows service. The documentation explains how to run Telegraf as a service on each platform; the default Windows install directory is
C:\Program Files\InfluxData\telegraf. - Official packages and images Release binaries and DEB/RPM packages come from InfluxData; the repository setup verifies the InfluxData archive key against the fingerprint published in the install guide, and the documentation recommends SHA checksum and GPG signature checks for downloads. The Docker Official Image
telegrafis available in Debian and Alpine variants, and nightly packages and images on quay.io are built from the master branch each day around midnight UTC. - Custom builder The custom builder in
tools/custom_buildertakes one or more configuration files, determines which plugins they need and compiles a binary containing only those plugins. The install guide states that this greatly reduces binary size, which matters on constrained devices. - Heartbeat output and agent status The heartbeat output plugin, available from Telegraf v1.37, reports an agent's hostname, statistics and configurations to a heartbeat service such as Telegraf Controller. Agent status evaluation rules, with their own variables and functions, determine when an agent is considered not reporting.
- Telegraf Controller Telegraf Controller is a separate InfluxData application that stores configurations, lets agents pull them and check for updates, and shows deployment-wide health and Telegraf versions. Configurations can be written in a code editor or assembled in the Telegraf Builder from a plugin library. Without a license it is limited to 20 configurations and 100 reporting agents.
- Release cadence and changelog Each release lists important changes, new plugins, features and bug fixes in the changelog and on GitHub Releases, including removals of deprecated plugins and options. Upcoming dates are tracked in a public calendar and GitHub milestones.
Where Telegraf fits
Collecting host and container metrics
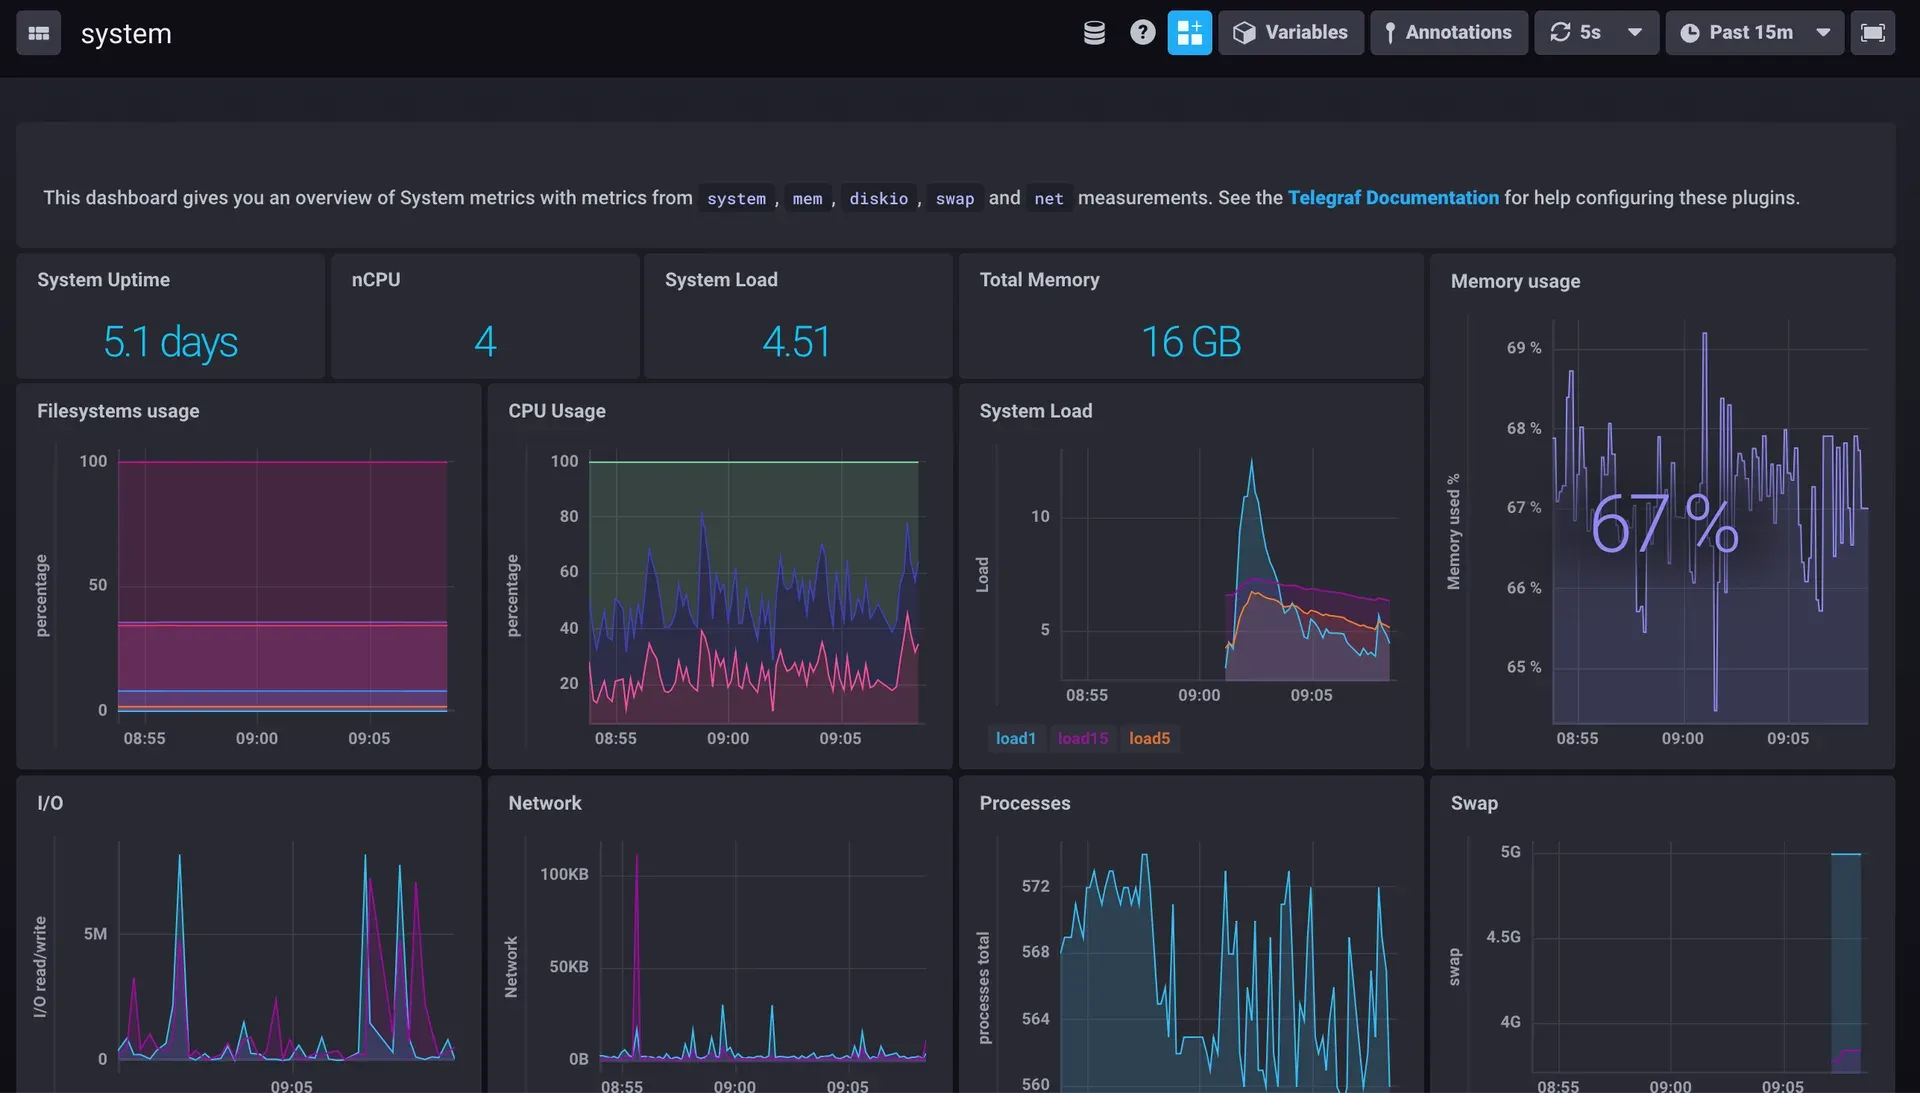
A typical agent configuration enables the cpu, mem, disk, net and system inputs, optionally the docker input, and an output such as InfluxDB v2 with its URL, organization, bucket and a token from an environment variable or secret store. The agent then collects at the configured interval and flushes in batches, and the documentation's configuration examples cover system and Docker monitoring.
Bridging Prometheus and other backends
The prometheus input scrapes Prometheus endpoints, including Kubernetes pods, and the prometheus_client output exposes collected metrics for a Prometheus server to scrape. With remote write serializers, the same metrics can also be sent to systems that accept Prometheus remote write, so Telegraf can sit between exporters and several backends at once.
Industrial data acquisition
Plants and labs use the OPC UA, Modbus, s7comm and MQTT consumer inputs to read machine and sensor values, then processors to rename, scale or convert them and outputs to write them to a time series database or message broker. The README groups OPC UA and Modbus under device plugins.
Shipping Windows events and counters
On Windows servers, the win_eventlog, win_perf_counters and win_wmi inputs collect event log entries, performance counters and WMI data, and the agent runs as a Windows service. Output plugins can forward these to the same destination as Linux hosts, so mixed fleets share one collection agent.
Transforming streams from message queues
With the kafka_consumer or mqtt_consumer input and a parser such as JSON v2 or XPath, Telegraf can read events from a queue, reshape them with processors such as regex, converter or Starlark, and write the result to a database, another topic or a file in Parquet or CSV format.
Managing configurations for agent fleets
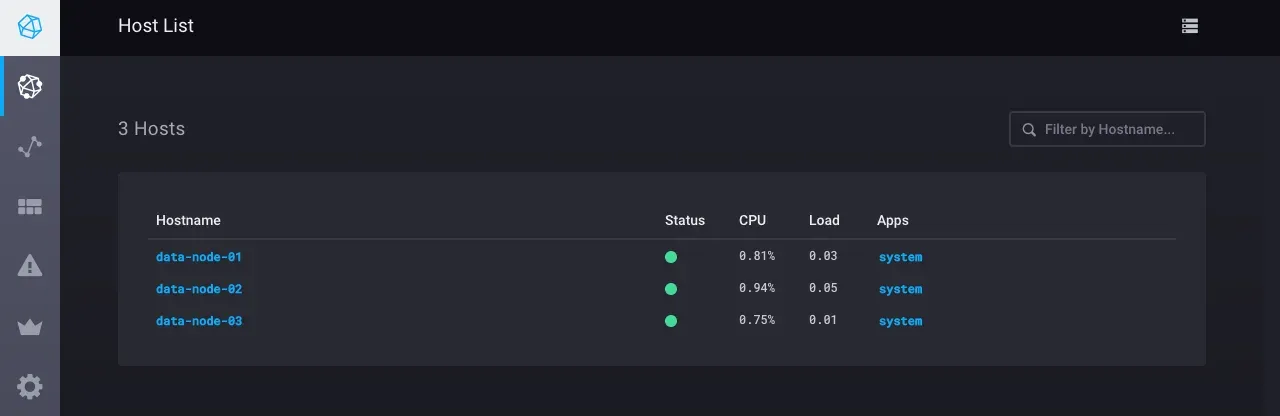
For larger deployments, Telegraf Controller holds configurations centrally, agents pull their configuration at startup and reload on changes, and the heartbeat output reports status. The Controller agent list and summary show how many agents report OK, warn or have stopped reporting, and which Telegraf versions they run.
Install
docker pull telegrafReviews of Telegraf
Be the first to share your experience with Telegraf.
Write a review
Loading review form…
Found Telegraf useful? Upvote it todayYour vote helps other IT teams find it in the daily ranking.