

What is Vector?
Vector is an open-source observability data pipeline written in Rust. It collects, transforms and routes logs and metrics from many sources to many destinations, and it can run both as an agent on individual hosts and as an aggregator that receives data from other agents. The GitHub repository describes it as a high-performance observability data pipeline, and the official website calls it a tool for building observability pipelines. Trace events are also part of the data model, but the concepts documentation states that trace support is limited and in alpha, covering a defined set of components such as the datadog_agent and opentelemetry sources, the datadog_traces and opentelemetry sinks, and the remap and sample transforms.
The project is developed by Datadog. The README states that Vector is maintained by Datadog's Community Open Source Engineering team (COSE), and release announcements are published by that team. The project's own pages describe Vector as vendor neutral: its sinks include Datadog alongside other commercial and open-source destinations. The vector.dev website also links to Datadog Observability Pipelines, and the reference architecture diagrams in the documentation show that Datadog product as an optional central management plane for Vector deployments.
Vector is distributed as a single binary. On Unix-like systems its only runtime dependency is libc, and statically linked musl builds are also published. The installation documentation covers an install script from sh.vector.dev, package managers (APT, dpkg, Helm, Homebrew, MSI, Nix, pacman, RPM and YUM), Docker images on Docker Hub (timberio/vector) and the GitHub Container Registry in debian, alpine, distroless-libc and distroless-static variants, Kubernetes through Helm, kubectl with kustomize or a community-supported operator, and builds from archives or source. GitHub release assets for v0.61.0 include DEB and RPM packages and tarballs for x86_64, ARM64 and ARMv7 Linux, a macOS arm64 tarball, and a Windows x64 MSI and ZIP archive, together with a SHA256SUMS file.
The latest release is v0.61.0, published on October 29, 2026. According to the release notes, scheme-less endpoints in the vector sink now default to https, which is the release's breaking change. The release adds an opensearch sink for self-managed OpenSearch, Amazon OpenSearch Service and Amazon OpenSearch Serverless, and lets the datadog_agent source accept the v3 series metrics intake format used by Datadog Agent 7.81.0 and newer. Security changes include TLS verification for the databricks_zerobus sink, a move of the distroless-libc image to a Debian 13 base, and an updated bundled Mozilla root store that removes the emSign ECC Root CA G3. The release also ships VRL 0.38.0, which adds a range function, and fixes in the gcp_pubsub, redis, mqtt and aws_ecs_metrics components.
Vector is licensed under the Mozilla Public License 2.0. Because the project is pre-1.0, the release notes state that minor versions can contain breaking changes, and each release has an upgrade guide. Vector is not a storage backend, dashboard or alerting system: it moves and reshapes data, and destinations such as Grafana Loki, Elasticsearch or Datadog store and query it.
Vector screenshots
Explore the interface. Open a screenshot to view it at full size.
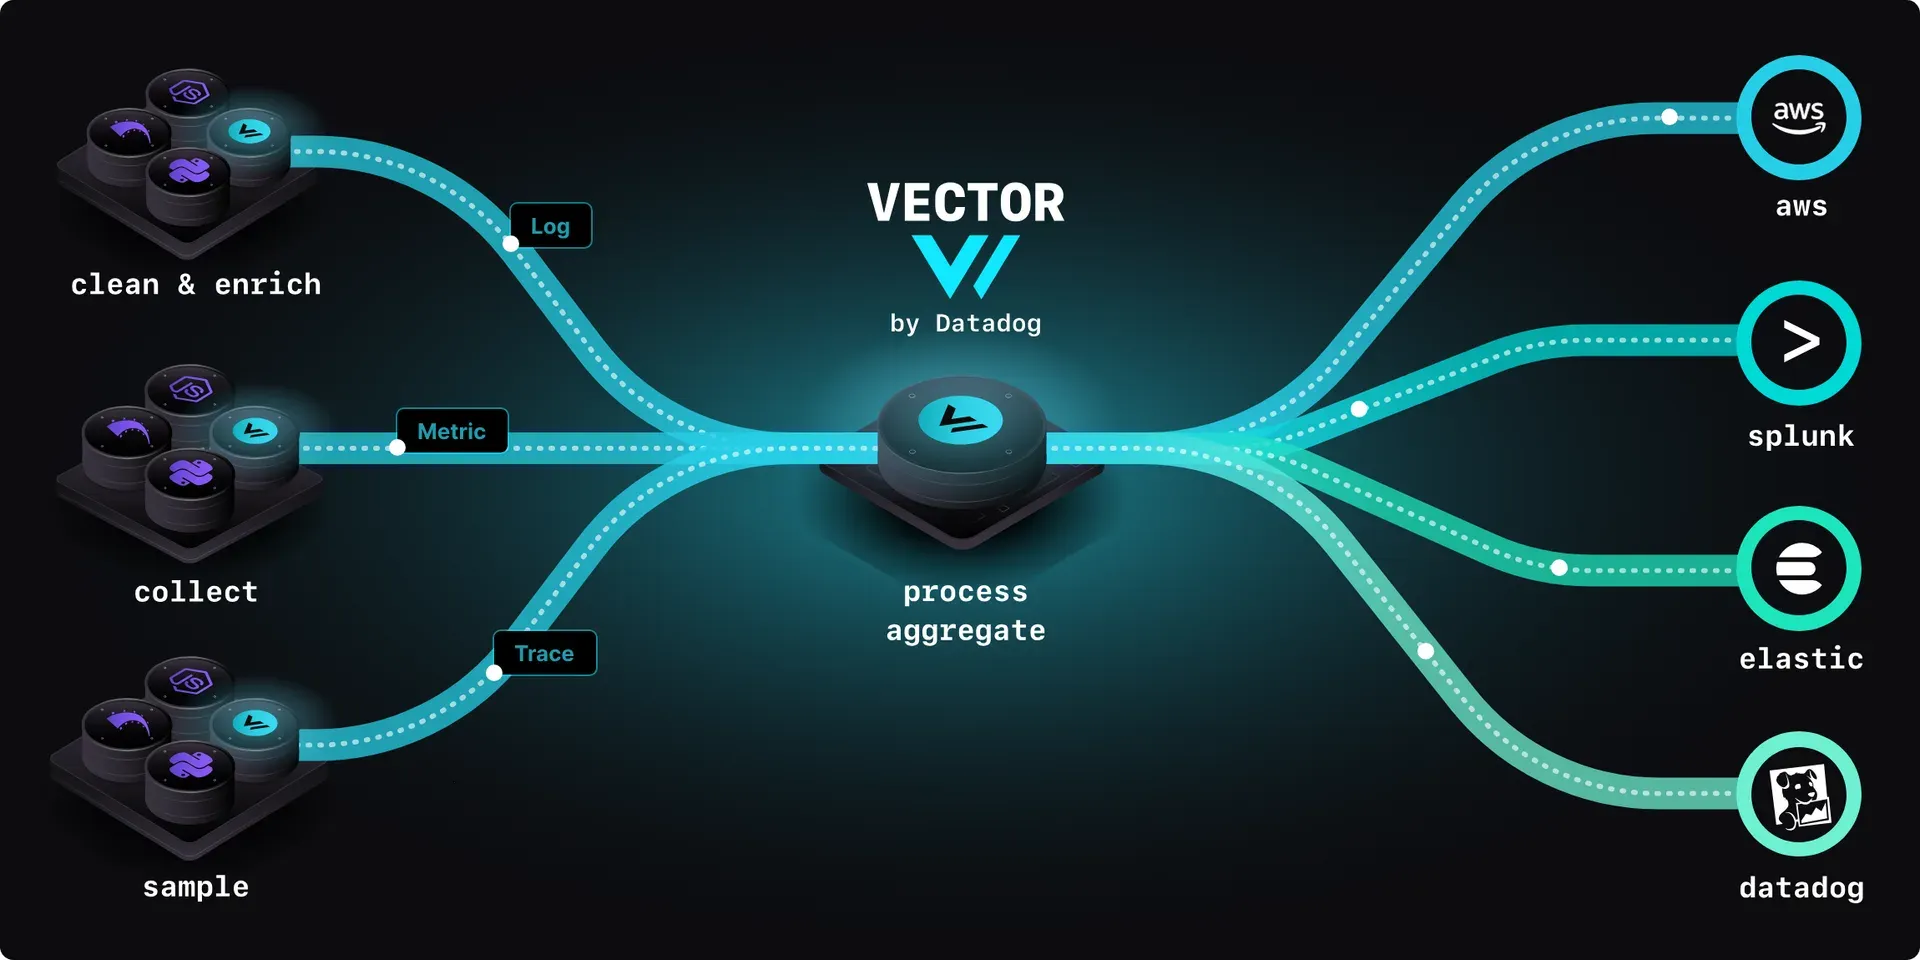
Official overview diagram from the Vector README: data is collected, cleaned and sampled, processed or aggregated by Vector, then routed to destinations.
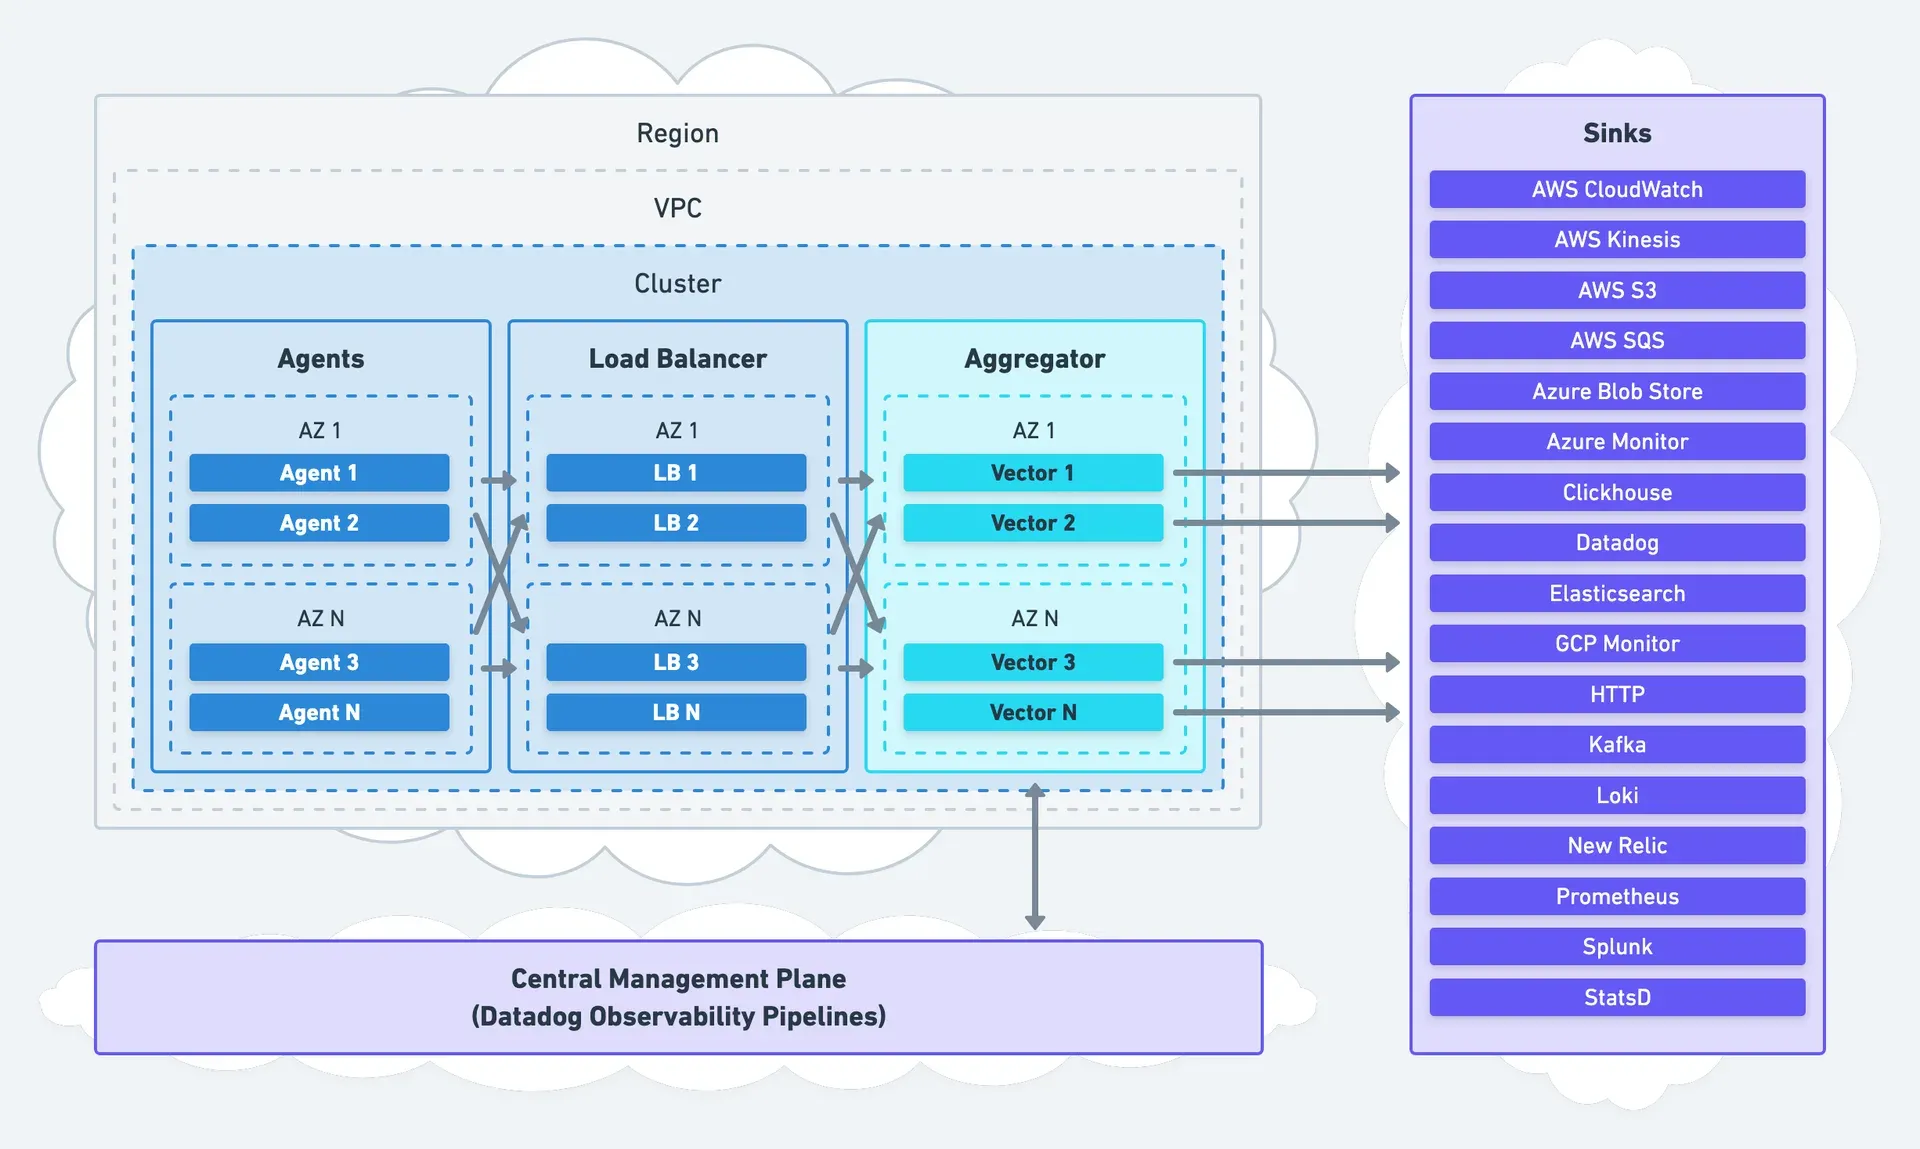
Aggregator reference architecture from the Vector docs, with Datadog Observability Pipelines shown as an optional central management plane.
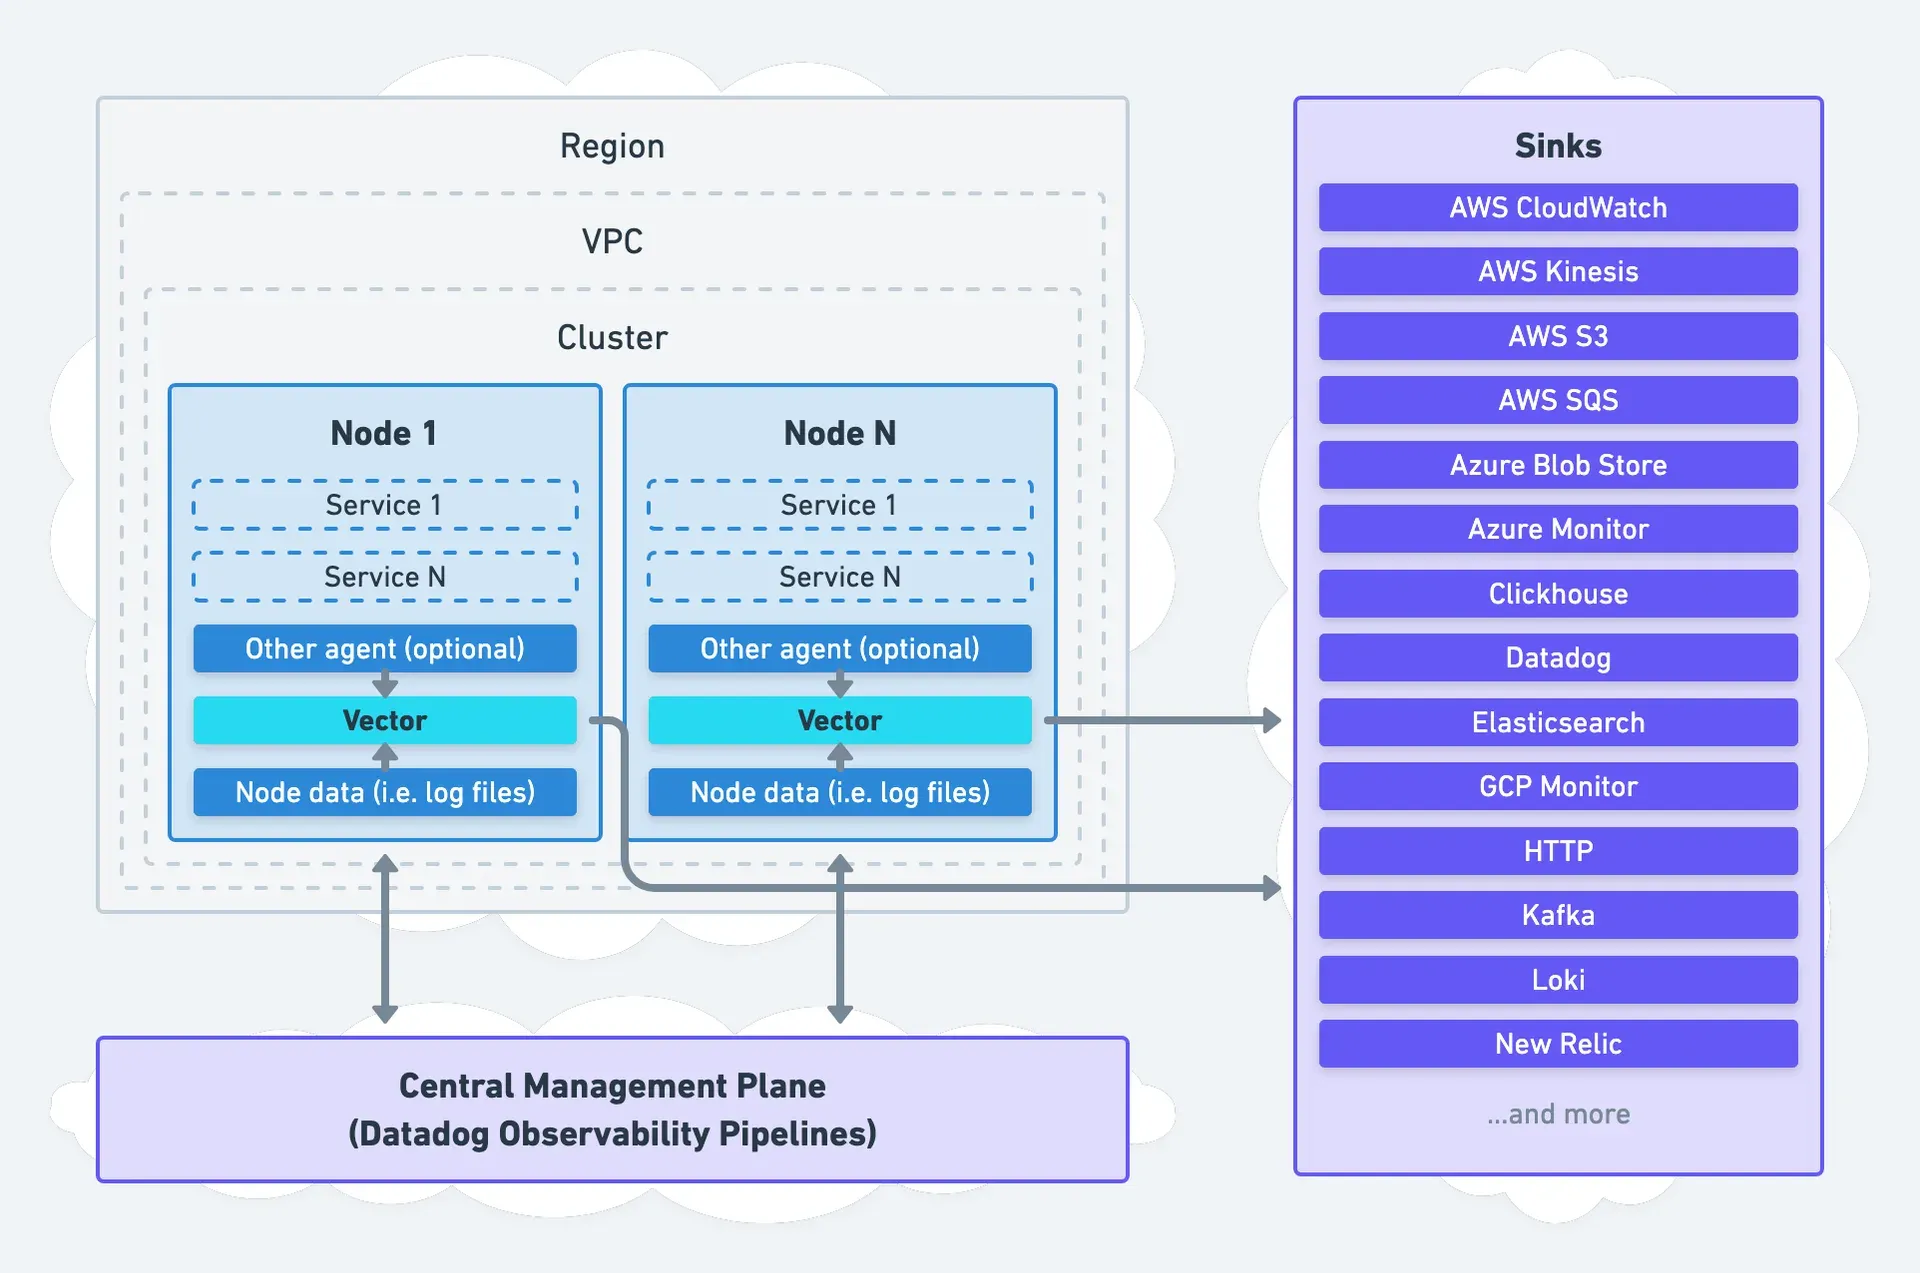
Agent reference architecture from the Vector docs: Vector runs on every node and reads node data such as log files.
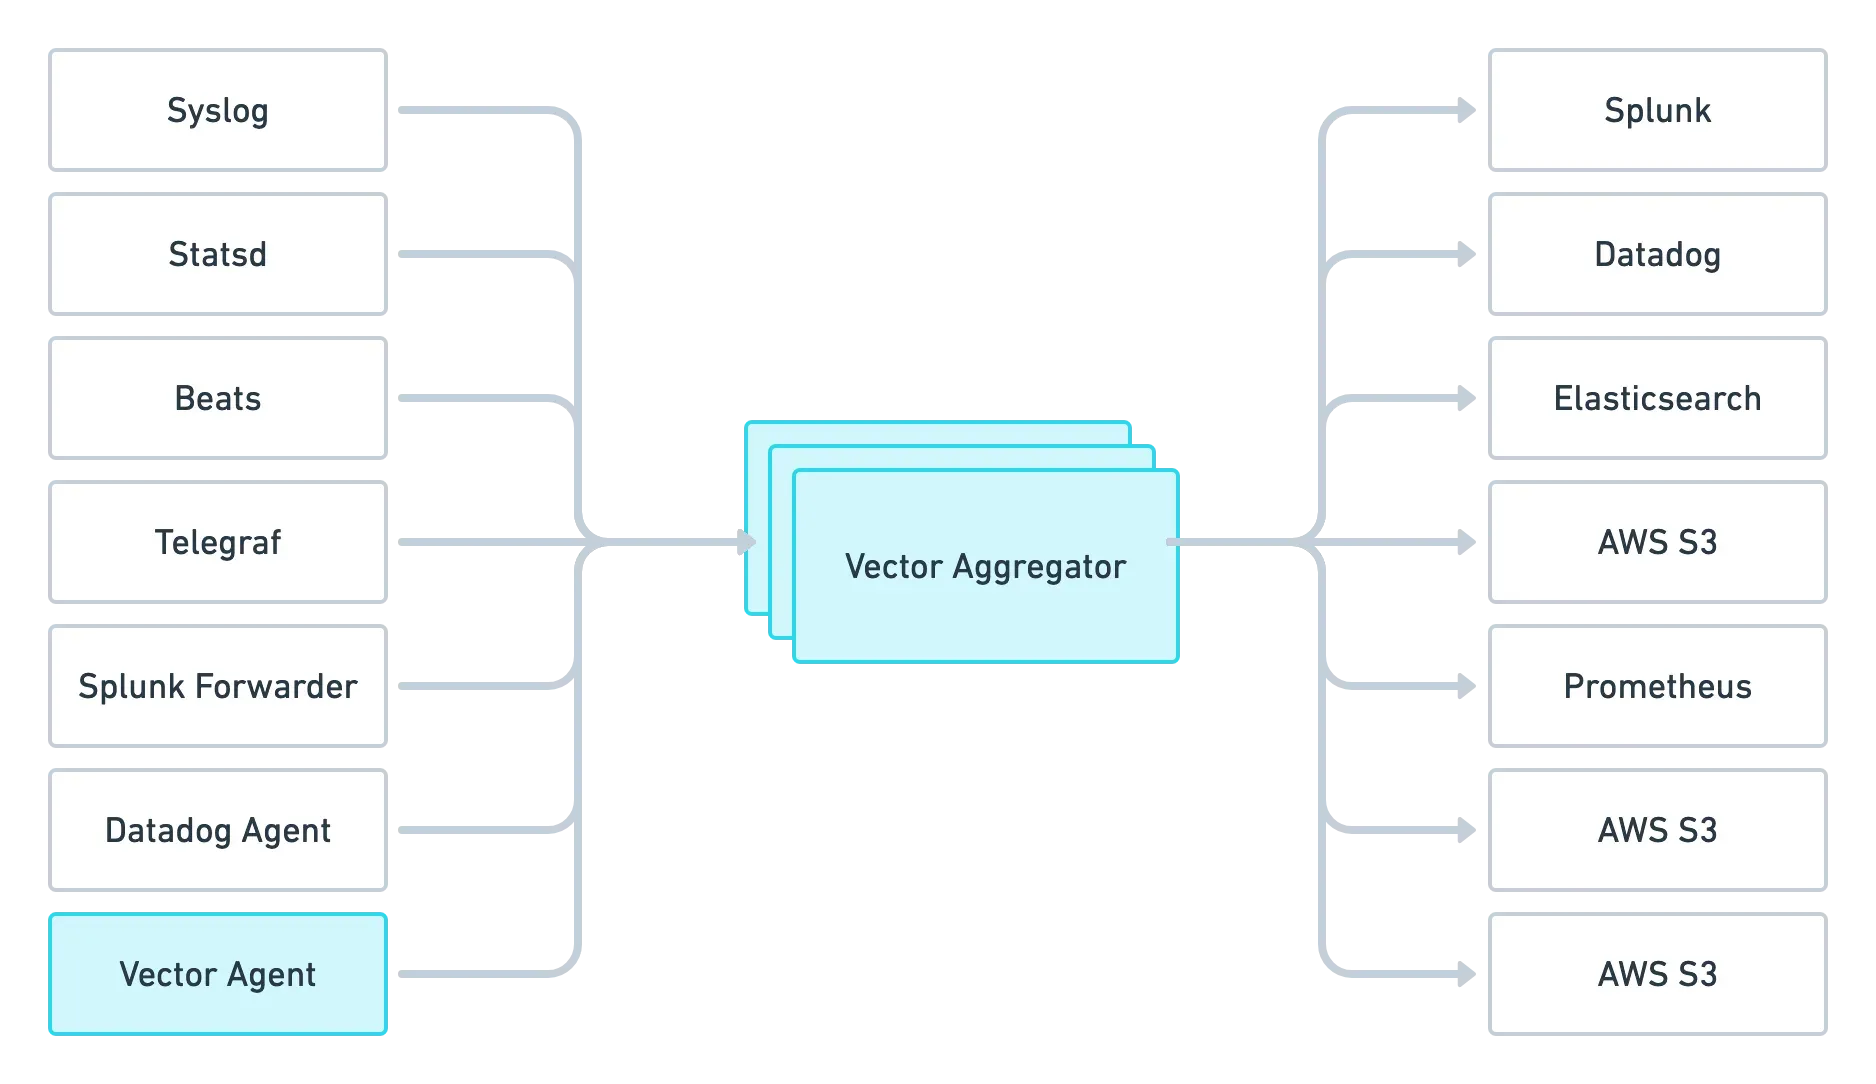
Official figure from the Vector website assets showing an aggregator receiving data from several agents and routing it to several backends.

vector top screenshot from the official debugging guide, captured with an earlier release (the header shows the former GraphQL API URL).
Source: official Vector project page.
Key capabilities
- Sources, transforms and sinks Vector configurations are built from three kinds of components. Sources ingest or receive data, transforms parse, filter, sample or aggregate events, and sinks deliver events to downstream services. The vector.dev homepage lists 47 sources, 18 transforms and 62 sinks, documented in the configuration reference.
- Pipeline as a directed acyclic graph Each component names its inputs, and the resulting pipeline is a directed acyclic graph in which data flows from sources to sinks. A component can emit zero or more events. The
vector graphcommand outputs the topology in DOT format so it can be rendered with Graphviz. - Vector Remap Language (VRL) VRL is an expression-oriented, domain-specific language for transforming logs and metrics, used through the remap transform and in conditions for filter and route transforms. It has built-in functions for parsing (for example parse_json, parse_apache_log, parse_timestamp), redaction and type conversion, and fallible functions must have their errors handled before a program compiles. An online VRL playground is available, with some functions unsupported there, per the VRL documentation.
- Log, metric and trace event model Log events are generic key/value structures and metric events represent operations on a time series. Trace events are treated as a special kind of log event; the documentation describes trace support as limited and in alpha, available in a listed subset of sources, transforms, sinks and codecs.
- Agent and aggregator roles Vector can run as a daemon that collects all data on one host, as a sidecar next to a single service, or as an aggregator that receives data from multiple upstream agents (Vector or others, such as syslog-ng) for central processing. These roles combine into distributed, centralized and stream-based topologies described in the deployment roles documentation.
- Buffers and backpressure Each sink has a configurable buffer, in memory by default, with a disk buffer available. When a buffer is full, the default
blockbehavior propagates backpressure upstream to sources, for example HTTP 429 responses or slower Kafka fetches, whiledrop_newestdrops new events instead. - End-to-end acknowledgements Sources can be configured to wait until events are delivered by sinks before acknowledging them upstream. The aggregator reference architecture combines acknowledgements with disk buffers for a system-of-record sink.
- Configuration in YAML, TOML or JSON Configuration files can be written in YAML (the documented default), TOML or JSON, and several files or glob patterns can be passed with
--config. Components can also be split into one directory per component type with the file name used as component ID. On most Linux systems the default file is/etc/vector/vector.yaml, and environment variables can be interpolated into configuration values. - Unit tests for transforms The
vector testsubcommand runs unit tests defined in configuration files. A test supplies input events to one or more transforms and checks outputs with VRL assertions such asassert!andassert_eq!, as described in the unit testing guide. - Observability API and CLI tools Vector ships a gRPC API, disabled by default and bound to 127.0.0.1:8686 when enabled, with an HTTP
/healthendpoint for load balancer and Kubernetes probes. The documentation warns that the API has no authentication and should not be exposed to untrusted clients. Thevector topdashboard andvector tapevent stream use it, per the API reference. - Self-monitoring The internal_logs and internal_metrics sources feed Vector's own logs and metrics into the same pipeline, so they can be transformed and sent to sinks such as ClickHouse or Prometheus remote write. Vector also writes its logs to stderr, and log levels are set with
-v/-qflags or the VECTOR_LOG environment variable. - Destinations across vendors Sinks cover cloud services (AWS CloudWatch, S3, Kinesis, SQS, SNS; Azure Blob Storage and Logs Ingestion; GCP Cloud Storage, Pub/Sub and Chronicle), observability platforms (Datadog, New Relic, Honeycomb, Axiom, Splunk HEC, Loki), databases and search engines (ClickHouse, Elasticsearch, OpenSearch, Postgres, InfluxDB, GreptimeDB, Doris, Databend) and streaming systems (Kafka, Pulsar, NATS, MQTT, Redis).
- Common sources Sources include file tailing, journald, syslog, Docker logs, Kubernetes logs, Windows Event Log, host metrics, StatsD, Prometheus scrape and remote write, OpenTelemetry, Splunk HEC, the Datadog Agent, Kafka, AWS S3 and SQS, Kinesis Firehose, HTTP server and client, and the vector source for Vector-to-Vector traffic.
- Linux, macOS and Windows packages Release assets cover x86_64, ARM64 and ARMv7 Linux in glibc and musl variants, DEB and RPM packages, macOS on Apple silicon, and Windows x64 as an MSI installer or ZIP archive. Operating-system guides exist for Amazon Linux, Arch Linux, CentOS, Debian, macOS, NixOS, Raspbian, RHEL, Ubuntu and Windows. The docs note that musl builds perform worse than glibc builds when running on multiple threads.
- Docker images Images are published as timberio/vector on Docker Hub and ghcr.io/vectordotdev/vector, tagged by version and distribution (debian, alpine, distroless-libc, distroless-static). The Docker guide mounts a vector.yaml into
/etc/vector/and reloads configuration with a SIGHUP signal. - Kubernetes deployment Vector requires Kubernetes 1.15 or later and is tested with 1.19 or later. It can be installed with the Helm chart, with kubectl and kustomize bases for the agent (DaemonSet) and aggregator (StatefulSet), or with a community-supported Vector Operator, as covered in the Kubernetes guide.
- Production reference architectures The documentation publishes agent, aggregator and unified architectures with sizing guidance: for example, it suggests limiting an agent to 2 vCPUs and 4 GiB of memory and provisioning aggregators with at least 4 vCPUs and 8 GiB each behind a load balancer. Separate pages cover hardening, high availability, rollout and capacity planning.
Where Vector fits
Collecting host and container logs
In the agent role, Vector runs on each node and reads data such as log files, journald entries, Docker logs or Kubernetes pod logs. On Kubernetes the kustomize base deploys it as a DaemonSet, and the Kubernetes guide states that Vector checkpoints its read position after each successful read so it resumes where it stopped after a restart. The agent architecture page describes collecting data directly, through another agent, or both.
Central aggregation and routing
In the aggregator role, Vector runs on dedicated nodes and receives data from upstream agents and systems, including other Vector instances through the vector source and sink. The project's aggregator architecture places multiple aggregators per network boundary, behind a load balancer or service discovery, with end-to-end acknowledgements and disk buffers. It can also run as a consumer of a pub-sub system such as Kafka.
Parsing, redacting and enriching events
The remap transform runs VRL programs on each event, for example to parse a JSON or Apache log line into structured fields, convert timestamps, delete fields or redact values. The homepage example uses the VRL redact function with a US social security number filter before sending Datadog Agent logs onward. Enrichment tables, including a memory enrichment table, can add lookup data to events.
Reducing volume before delivery
Transforms such as filter, sample, dedupe, throttle, reduce, aggregate and log_to_metric cut or summarise data before it reaches a sink. The configuration reference example sends a sampled stream to Elasticsearch while archiving the full parsed stream to AWS S3 with gzip compression and date-partitioned keys. A tag cardinality limit transform applies to metrics.
Sending one stream to several backends
Because each sink names its inputs, the same events can be delivered to several destinations at once, for example Datadog, New Relic, Loki or object storage. Metrics can be exposed with the Prometheus exporter sink or pushed through Prometheus remote write, which connects Vector to systems such as Prometheus. The README lists vendor transitions and agent consolidation among the project's stated use cases.
Testing and inspecting pipelines
Pipeline changes can be checked with vector validate and the unit tests run by vector test. On a running instance with the API enabled, vector top shows per-component event and byte counts, and vector tap streams sampled events from selected components. The debugging guide walks through both tools.
Install
curl --proto '=https' --tlsv1.2 -sSfL https://sh.vector.dev | bashReviews of Vector
Be the first to share your experience with Vector.
Write a review
Loading review form…
Alternatives to Vector
 Grafana LokiGrafana Loki is an open-source, multi-tenant log aggregation system that stores compressed logs and indexes only labels, with native Grafana support.LLogdyLogdy is an Apache-2.0 single-binary log viewer that streams files, stdin and sockets into a local web UI with filters and TypeScript parsers.
 Logz.ioLogz.io delivers log management, infrastructure monitoring and distributed tracing as a managed SaaS built on open-source projects like OpenSearch, Prometheus and Jaeger.