

What is VictoriaMetrics?
VictoriaMetrics is an open-source time series database and monitoring solution developed by the company of the same name. It stores metrics, accepts data from Prometheus and many other agents and protocols, and answers queries in PromQL and in MetricsQL, its own PromQL-compatible query language. The about page names four co-founders, including CTO Aliaksandr Valialkin. The GitHub repository dates from 2018. Both the single-node version and the cluster version are published in the VictoriaMetrics/VictoriaMetrics repository under the Apache License 2.0, and the code is written in Go.
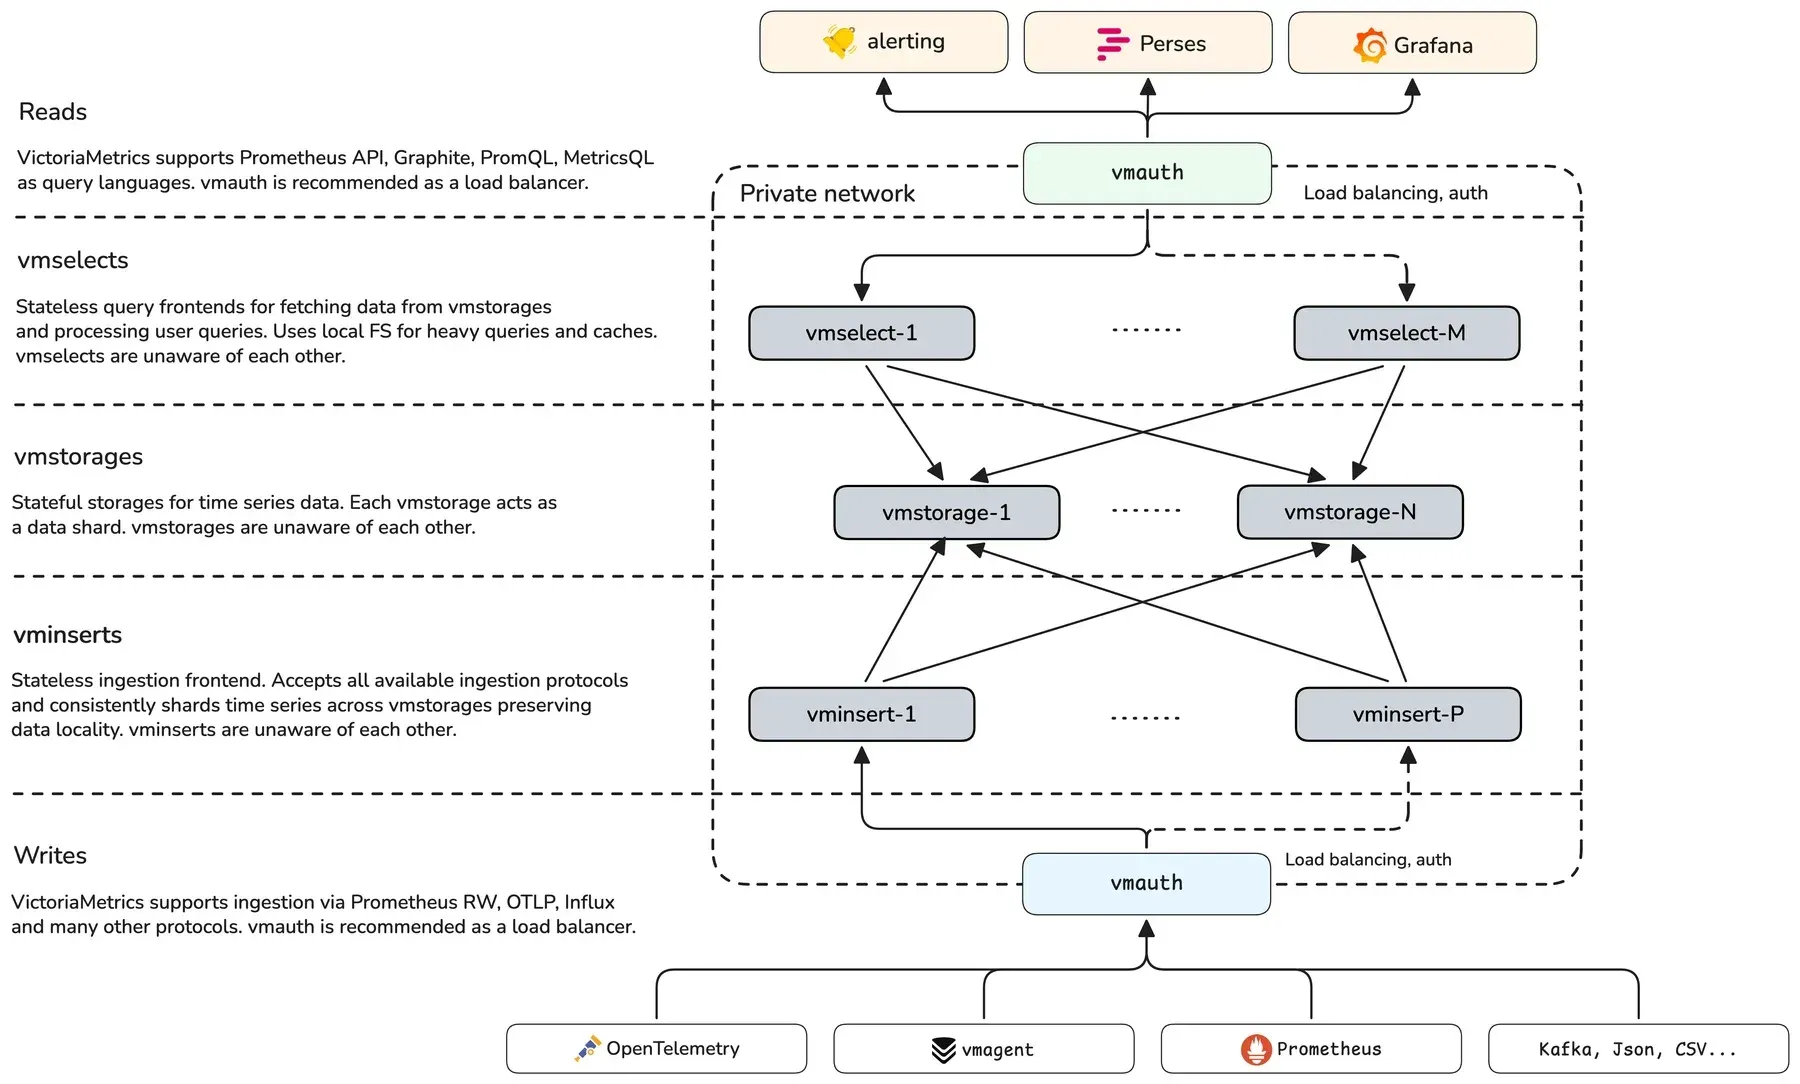
The project ships two deployment types. The single-node version is one binary configured with command-line flags. It listens on port 8428 and serves the vmui web interface at /vmui. The cluster version splits the work into stateless vminsert and vmselect nodes and stateful vmstorage nodes in a shared-nothing design, adds multitenancy and optional replication, and is documented with the recommendation to use the single-node version for ingestion rates below about one million data points per second. Around the database sit separate components: vmagent for scraping and forwarding, vmalert for alerting and recording rules, vmauth as an authenticating proxy and load balancer, vmbackup and vmrestore for snapshots, and vmctl for data migration.
Release builds are published on GitHub Releases for Linux (amd64, arm64, arm, 386, s390x), macOS, FreeBSD, OpenBSD and Windows amd64, with community, cluster and enterprise archives side by side. Docker images are on Docker Hub and Quay, Helm charts come from the VictoriaMetrics/helm-charts repository and an OCI registry, and a Kubernetes operator manages the components through custom resources. Ansible roles and a DigitalOcean marketplace app are also listed in the quick start guide.
The latest release is v1.156.0, published on November 9, 2026. It changed how Enterprise components are started: they now run with a -eula flag that accepts the Enterprise Solution Agreement, license keys are no longer verified, and the older -license flags are treated as -eula. The same release added per-URL persistent queue paths in vmagent, Azure workload identity for service discovery, a -notifier.sanitizeLabelNames flag in vmalert and a set of stream aggregation and MetricsQL fixes. Feature releases arrive roughly every two weeks, and the changelog tracks each one.
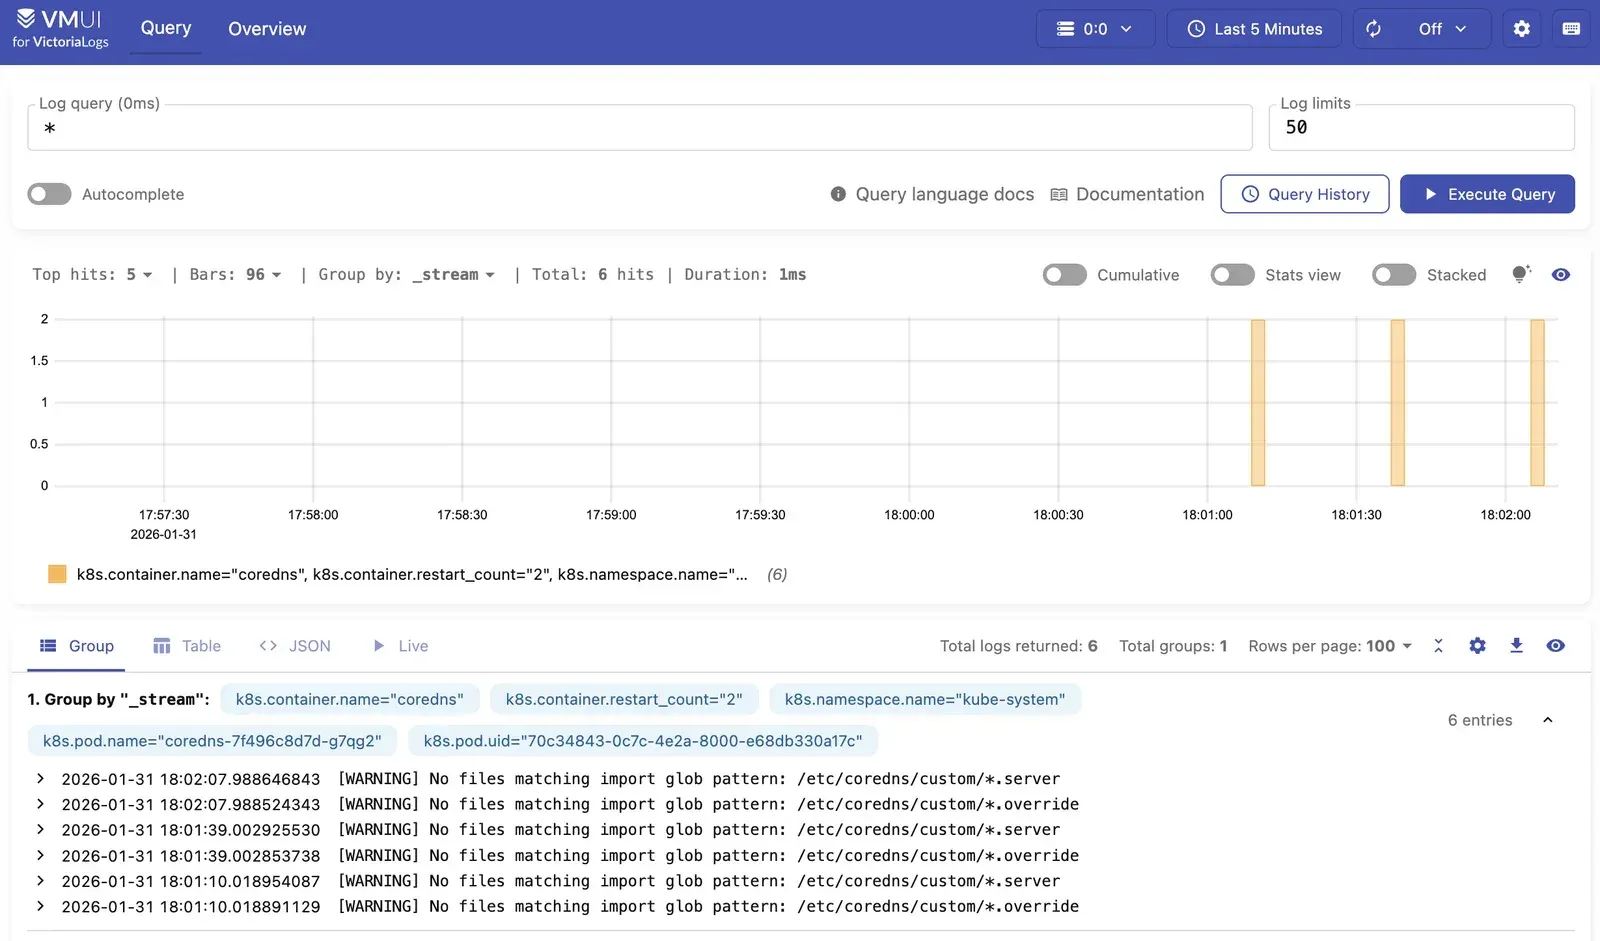
The same company maintains VictoriaLogs, a log database, and VictoriaTraces, a database for distributed tracing data, as separate Apache-2.0 repositories that share the vmui interface and Kubernetes tooling. A commercial Enterprise edition adds features such as downsampling, multiple retentions and long-term support releases, and VictoriaMetrics Cloud runs managed deployments on AWS. Dashboards are not part of the database itself: Grafana, Perses or another frontend reads data through the Prometheus-compatible query API.
Key capabilities
- Prometheus-compatible storage VictoriaMetrics implements the Prometheus querying API, including
/api/v1/query,/api/v1/query_range,/api/v1/series,/api/v1/labelsand/federate, and accepts the Prometheus remote write protocol. It can serve as long-term storage behind existing Prometheus servers or replace Prometheus as the data source in Grafana. The project also exposes a Graphite API so it can stand in for a Graphite data source. - MetricsQL MetricsQL is a PromQL-like query language that keeps PromQL syntax working and adds functions and behaviour of its own. Queries written for Prometheus usually run unchanged, while MetricsQL-specific functions such as
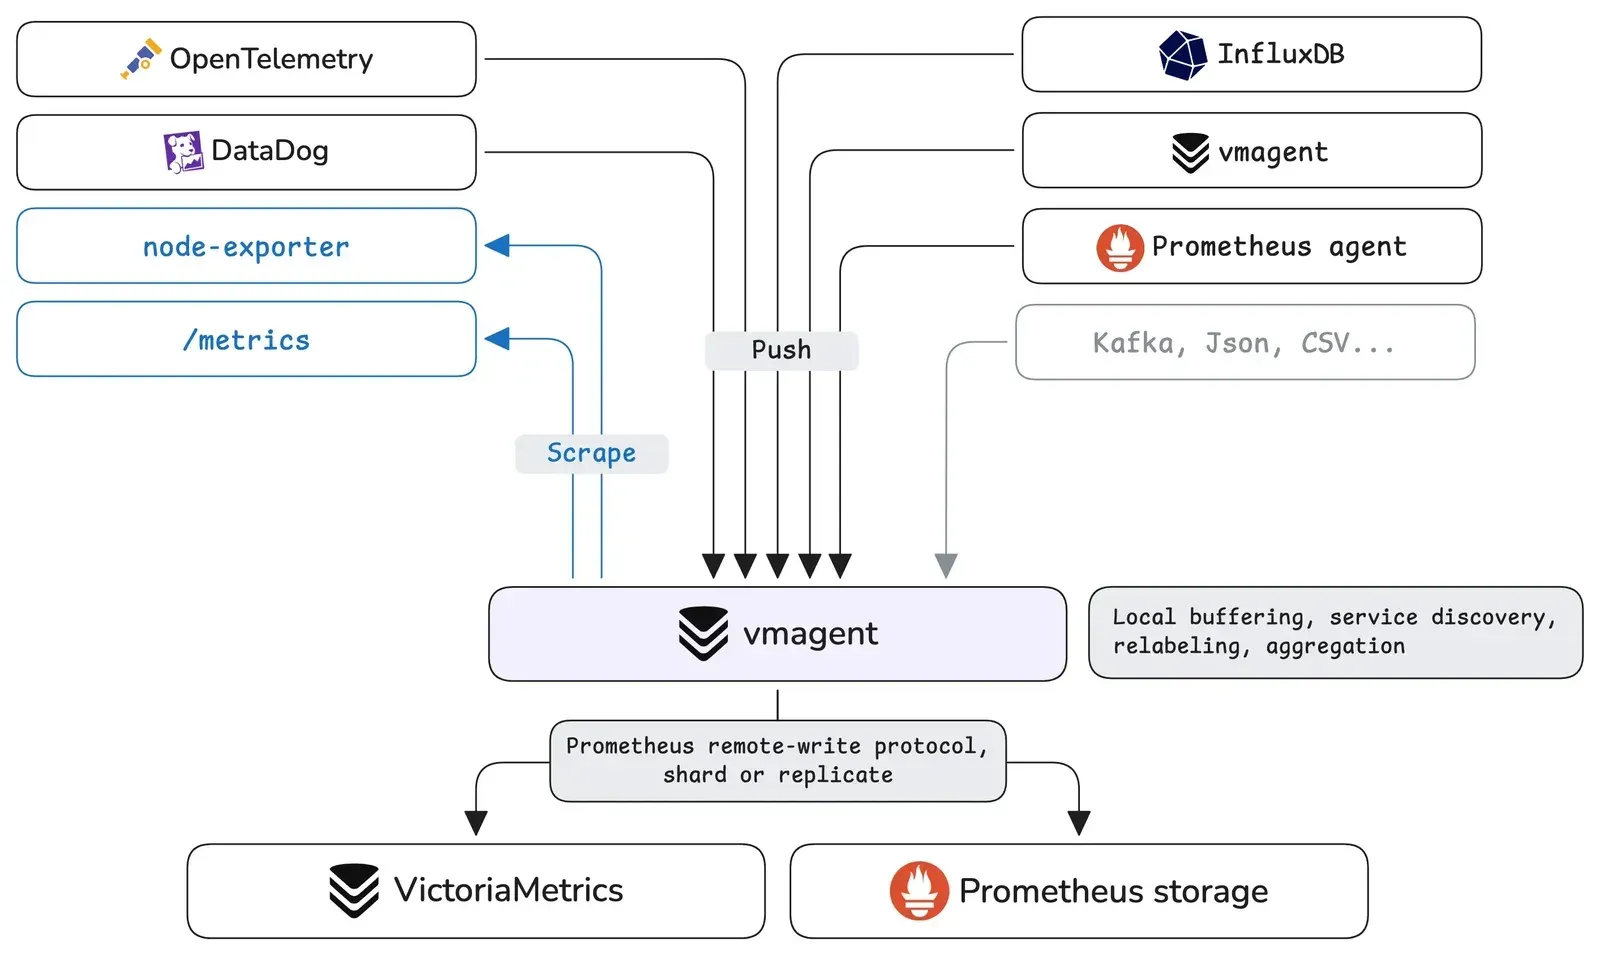
range_avgandrunning_avgare available for additional analysis. - Ingestion protocols Besides Prometheus scraping and remote write, the README lists InfluxDB line protocol over HTTP, TCP and UDP, Graphite plaintext with tags, OpenTSDB telnet and HTTP, JSON lines, CSV, a native binary format, DataDog agent and DogStatsD, the NewRelic infrastructure agent and OpenTelemetry metrics. This lets one instance collect data from several existing agents.
- Single-node version One binary with no external dependencies, configured through command-line flags. Data is kept for
-retentionPeriod, which defaults to one month with a minimum of 24 hours, under-storageDataPath. The documentation positions it for most setups and describes vertical scaling to millions of series. - Cluster version Vminsert (port 8480) shards incoming series across vmstorage nodes (port 8482), and vmselect (port 8481) queries all of them. Tenants are identified by
accountID:projectIDand created on first write, and-replicationFactor=Nkeeps N copies of each sample so data stays queryable with up to N-1 storage nodes down. - vmagent vmagent scrapes Prometheus targets, accepts pushed data in the same protocols as the database, applies relabeling and stream aggregation, and forwards everything over remote write to VictoriaMetrics or any Prometheus-compatible storage. It buffers data on disk when a destination is unavailable, and v1.156.0 added
-remoteWrite.queuePathto set the queue path for each destination. - vmalert vmalert evaluates alerting and recording rules in a Prometheus-style rule format against a configured datasource and sends notifications to Alertmanager. It works with VictoriaMetrics, VictoriaLogs, VictoriaTraces, Graphite and other Prometheus-compatible storage, and can persist alert state as time series to restore it after a restart.
- vmauth An HTTP proxy that authorizes requests with Basic Auth, bearer tokens or JWT, routes them by path, host, query arguments or headers, and load balances across backends with failover and retries. IP filters and mTLS-based routing are listed as Enterprise features.
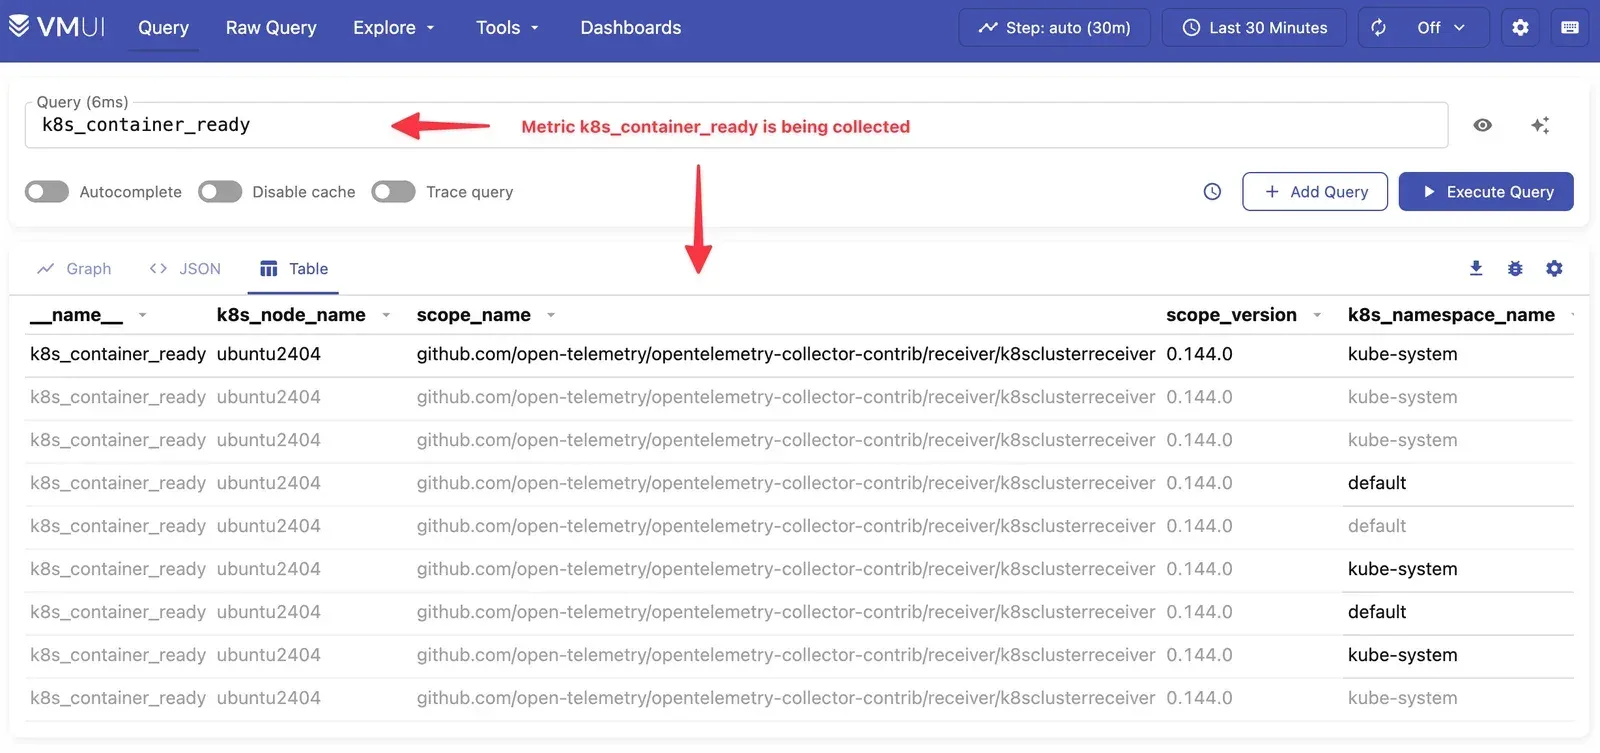
- vmui and exploration tools The built-in web interface runs queries with graph, JSON and table views and includes a metrics explorer, a cardinality explorer based on
/api/v1/status/tsdb, top queries and active queries. VictoriaLogs and VictoriaTraces ship their own variants of vmui. - Stream aggregation and relabeling Incoming samples can be aggregated over time windows before storage, with outputs such as
total,increase,avgandrate_sum, which the README describes as usable as a StatsD alternative. Relabeling rules modify or drop series at ingestion, and the README also lists a cardinality limiter. - Backups and migration Instant snapshots are created through
/snapshot/createand copied to object storage with vmbackup, then restored with vmrestore. vmctl migrates data from Prometheus and Thanos snapshots, InfluxDB and OpenTSDB, from other VictoriaMetrics installations, and over remote read from Thanos, Cortex, Mimir and Promscale. - Grafana integration Grafana connects through its built-in Prometheus data source at
http://<host>:8428for single-node or the vmselect/select/<tenant>/prometheuspath for the cluster. The separate VictoriaMetrics datasource plugin (victoriametrics-metrics-datasource, AGPL-3.0) adds MetricsQL support in the query editor. - Binaries and Docker Each release publishes archives for Linux, macOS, FreeBSD, OpenBSD and Windows plus a vmutils archive with the companion tools. The quick start runs the
victoriametrics/victoria-metricsimage with a mounted data volume and port 8428, and a Docker Compose file in the repository starts a cluster together with Grafana. - Helm charts and Kubernetes operator The Helm repository at
https://victoriametrics.github.io/helm-charts/provides charts such as victoria-metrics-single, victoria-metrics-cluster, victoria-metrics-agent, victoria-metrics-alert and victoria-metrics-k8s-stack, plus charts for VictoriaLogs and VictoriaTraces. The operator manages resources such as VMSingle, VMCluster, VMAgent and VMAlert as Kubernetes custom resources. - Enterprise edition The Enterprise builds add downsampling, multiple retentions, vmbackupmanager for automated backups, vmgateway with advanced auth and rate limiting, automatic TLS certificates, mTLS between components, Kafka and Google PubSub integrations, multitenant vmalert, anomaly detection and FIPS 140-3 compatible builds. Evaluation in non-production setups is allowed with
-eula, while production use requires an Enterprise contract, and no price is published. - Long-term support releases LTS lines are published for the Enterprise edition only. A new line starts every six months, each receives bug and security fixes for 12 months, and the two latest lines are supported at once. In November 2026 these are v1.148.x and v1.136.x. Community users get the same fixes in the latest regular release.
- VictoriaMetrics Cloud The managed service runs VictoriaMetrics single-node or cluster, VictoriaLogs and VictoriaTraces deployments in five AWS regions (Frankfurt, Ireland, N. Virginia, Ohio and Singapore). The product page lists VictoriaMetrics from $200 per month for the initial tier (500k active series, 16.6k data points per second), storage at $0.511 per GB per month and egress at $0.09 per GB, metered hourly, with $200 of trial credits valid for 30 days. Billing is also available through AWS Marketplace.
Where VictoriaMetrics fits
Long-term storage for Prometheus
Existing Prometheus servers keep scraping and add a remote_write section pointing to VictoriaMetrics, which then holds the history for the configured retention period. Grafana dashboards switch their data source to VictoriaMetrics, and queries from several Prometheus instances become available through one endpoint, described in the README as a global query view. The Prometheus integration page covers the remote write settings.
Kubernetes cluster monitoring
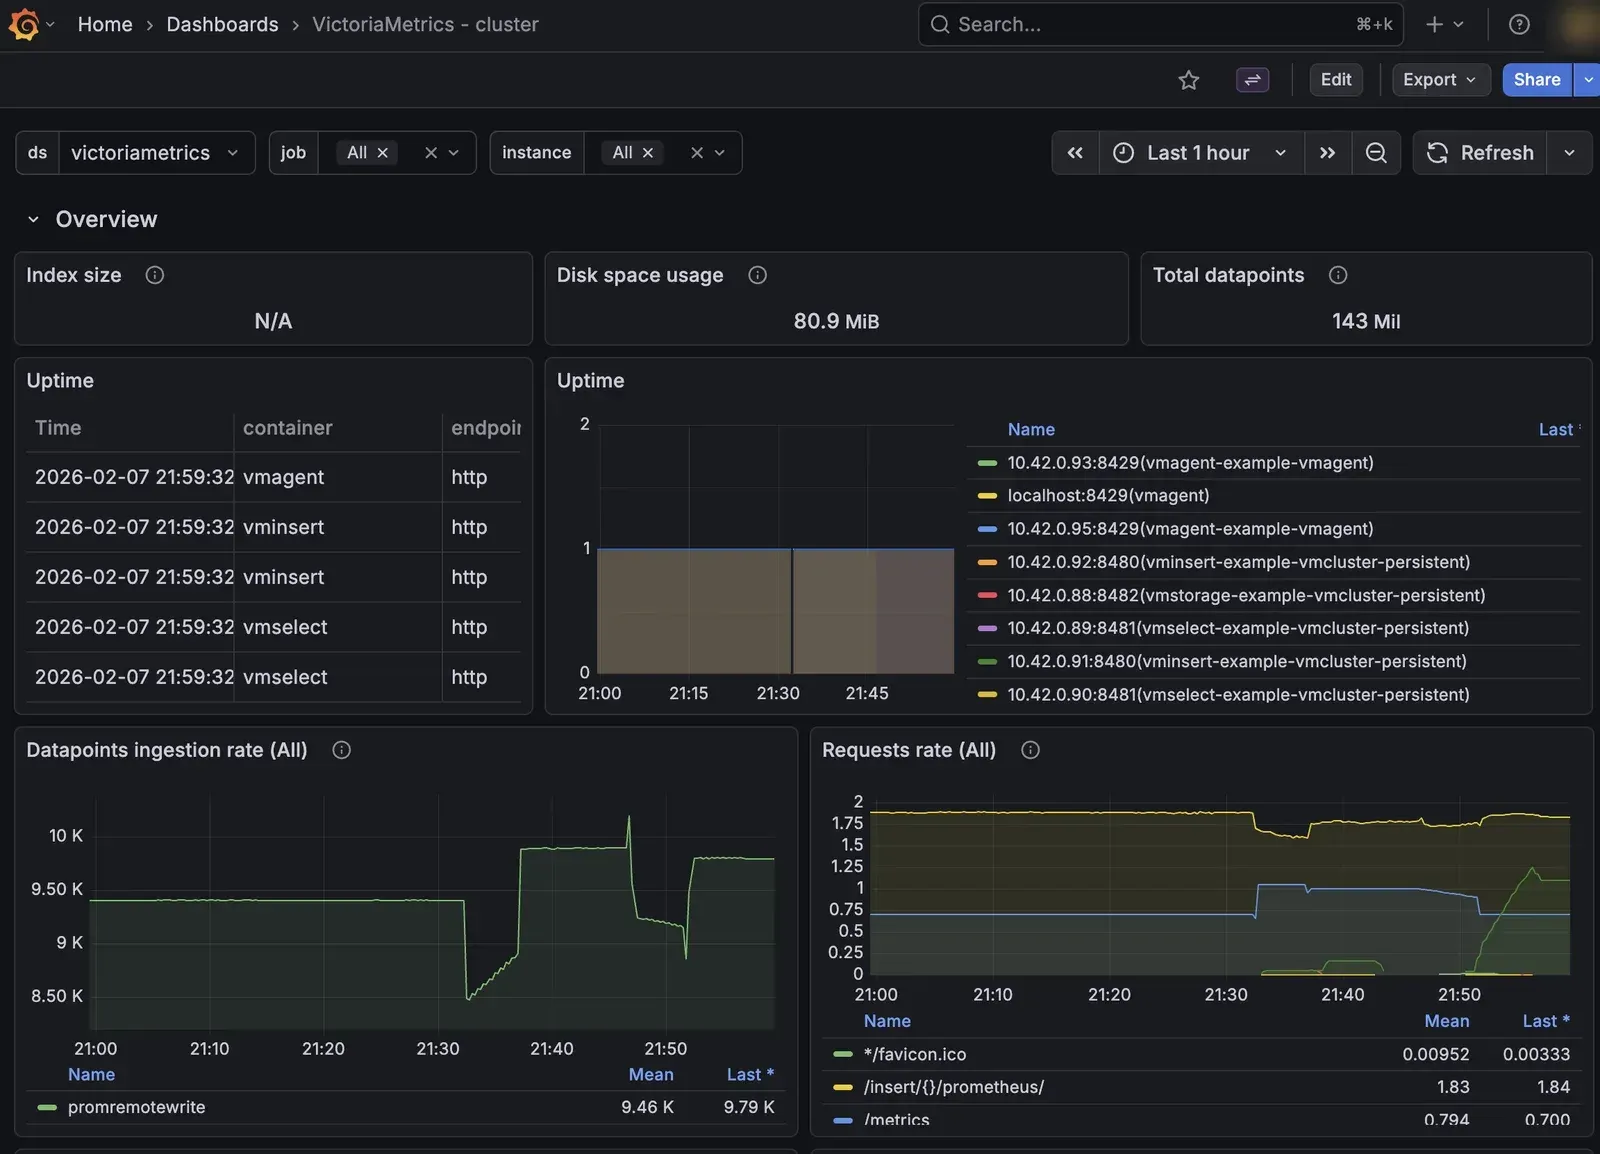
The victoria-metrics-k8s-stack Helm chart installs the operator, Grafana, node-exporter and kube-state-metrics, and renders custom resources for a VMSingle or VMCluster database, VMAgent, VMAlert and VMAlertmanager, with dashboards and recording rules taken from kube-prometheus. By default the operator converts existing Prometheus Operator objects into its own scrape resources, and the same chart can add VictoriaLogs and VictoriaTraces instances.
Replacing Graphite, InfluxDB or StatsD ingestion
Agents that already speak Graphite plaintext, InfluxDB line protocol or OpenTSDB send data to VictoriaMetrics without changes on the client side, and stream aggregation can replace a StatsD aggregation layer. Historical data is moved with vmctl. The InfluxDB integration page describes how each line protocol field becomes a series named {measurement}_{field}, with the separator configurable by flag.
Multi-tenant metrics platform
The cluster version separates tenants by accountID:projectID in the insert and select URLs, so different teams or customers write to and query their own namespace. vmauth in front of the cluster maps users or tokens to tenant URLs and balances load across vminsert and vmselect nodes.
Alerting and recording rules
vmalert loads Prometheus-style rule files, evaluates them against VictoriaMetrics, sends firing alerts to Alertmanager and writes recording rule results back over remote write. The repository includes ready-made alerting rules for the VictoriaMetrics components, including vmbackupmanager, that can be loaded into the same vmalert instance.
Metrics, logs and traces from one vendor
Teams that also need log and trace storage can run VictoriaLogs and VictoriaTraces next to VictoriaMetrics, deployed by the same operator and Helm repository and queried in vmui or Grafana. Similar open-source projects listed on iThub include Prometheus and InfluxDB for metrics, and Grafana Loki for logs, while Grafana is the most common frontend.
Install
docker run -it --rm -v `pwd`/victoria-metrics-data:/victoria-metrics-data -p 8428:8428 victoriametrics/victoria-metrics:v1.156.0 --selfScrapeInterval=5s -storageDataPath=victoria-metrics-dataReviews of VictoriaMetrics
Be the first to share your experience with VictoriaMetrics.
Write a review
Loading review form…
Found VictoriaMetrics useful? Upvote it todayYour vote helps other IT teams find it in the daily ranking.