
What is Chrome DevTools MCP?
Chrome DevTools MCP is the official Model Context Protocol server from the Chrome DevTools team at Google, published in the ChromeDevTools/chrome-devtools-mcp repository and on npm as chrome-devtools-mcp. Google now presents it under the name Chrome DevTools for agents. It lets a coding agent such as Antigravity, Claude, Cursor or Copilot control and inspect a live Chrome browser: open and navigate pages, click and fill forms, read console messages with source-mapped stack traces, inspect network requests, take screenshots and accessibility-tree snapshots, record performance traces and run Lighthouse audits. Automation is built on Puppeteer.
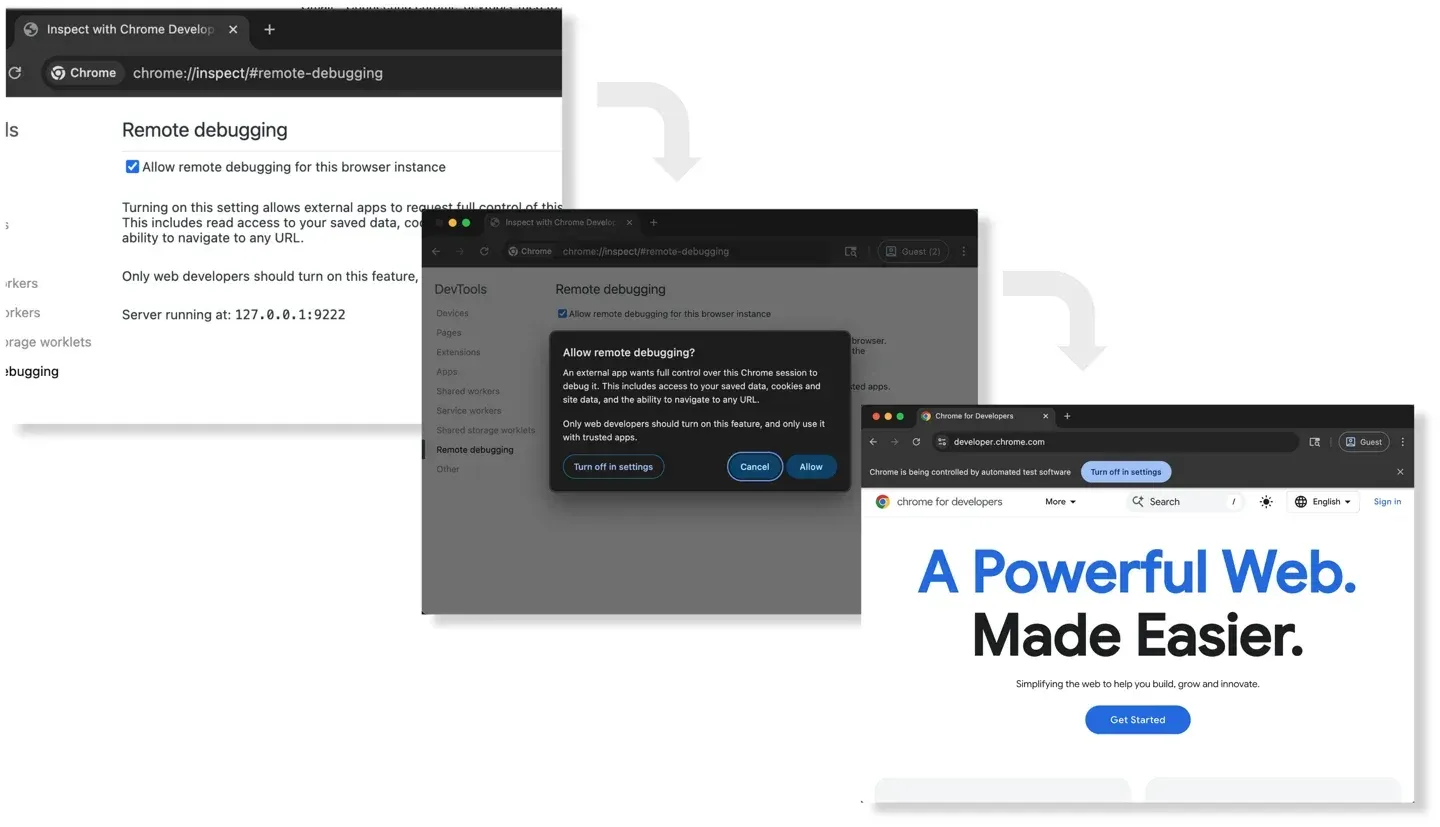
The Chrome DevTools team announced the server as a public preview on the Chrome for Developers blog on September 23, 2025, in the post Chrome DevTools (MCP) for your AI agent. A second post on December 11, 2025, Let your Coding Agent debug your browser session, introduced automatic connection to an already running Chrome session, which relies on a remote debugging permission flow added in Chrome M144. According to the Chrome DevTools for agents page, the server comes pre-bundled with Antigravity 2.0.
The server runs locally as a Node.js process that the MCP client starts with npx -y chrome-devtools-mcp@latest. The same npm package installs a chrome-devtools command-line interface and seven agent skills, and the repository ships plugin manifests for Claude Code, VS Code, Cursor and Gemini CLI. Requirements are a Node.js LTS release, npm and the current stable Chrome or newer. The project officially supports Google Chrome and Chrome for Testing only. Other Chromium-based browsers may work, but the README states that this is not guaranteed, and that fixes and support target the latest Extended Stable Chrome.
The current release is 1.13.0, published on November 11, 2026. It adds logpoints built on the DevTools BreakpointManager, page-scoped network mocks and upstream responses for those mocks, and disables set_logpoints when JavaScript evaluation is turned off. Release 1.12.0 of October 22, 2026 added live config reload and parallel tool calls on different pages. The full history is in the changelog.
The code is TypeScript under the Apache-2.0 license. The README carries its own disclaimers: the server exposes the content of the browser instance to MCP clients, which can inspect, debug and modify any data in the browser or in DevTools, and the project asks users to avoid sharing sensitive or personal information they do not want to share with MCP clients. Performance tools may send trace URLs to the Google Chrome UX Report (CrUX) API to add real-user field data to lab data; the --no-performance-crux flag disables this.
Google also collects usage statistics, such as tool invocation success rates, latency and environment information, to improve the reliability and performance of the tool. Collection is enabled by default and handled under the Google Privacy Policy. It is turned off with the --no-usage-statistics flag, or when the CHROME_DEVTOOLS_MCP_NO_USAGE_STATISTICS or CI environment variable is set, and it is independent of Chrome browser metrics: opting out of one does not opt out of the other. The server also checks npm for updates unless CHROME_DEVTOOLS_MCP_NO_UPDATE_CHECKS is set.
Key capabilities
- Client setup guide The client configuration guide covers Amp, Antigravity, IBM Bob, Claude Code, Cline, Codex, Command Code, Copilot CLI, Copilot in VS Code, Cursor, Devin CLI, Factory CLI, FLUJO, Gemini CLI, Gemini Code Assist, Grok Build CLI, JetBrains AI Assistant and Junie, Kiro, Katalon Studio, Mistral Vibe, OpenCode, Pi, Qoder, Qoder CLI, Visual Studio, Warp and Windsurf. All use the same
npx -y chrome-devtools-mcp@latestentry, and several give one-line commands such asclaude mcp add chrome-devtools --scope user npx chrome-devtools-mcp@latest. The browser starts only when the agent first calls a tool that needs it. - Plugins and bundled skills A plugin installs the MCP server together with all skills: in Claude Code through
/plugin marketplace add ChromeDevTools/chrome-devtools-mcpand/plugin install chrome-devtools-mcp@chrome-devtools-plugins, and in VS Code and Gemini CLI through their own plugin or extension commands. The seven skills are chrome-devtools, chrome-devtools-cli, a11y-debugging, cookie-debugging, debug-optimize-lcp, memory-leak-debugging and troubleshooting. - Input automation Nine default tools act on page elements:
click,drag,fill,fill_form,handle_dialog,hover,press_key,type_textandupload_file. Elements are addressed by IDs from a page snapshot, and Puppeteer waits for each action's result. A coordinate-basedclick_atrequires--experimentalVision. - Pages, navigation and concurrent sessions
list_pages,new_page,navigate_page,select_page,close_pageandwait_formanage tabs and wait for text to appear. Page ID routing is on by default, so page-scoped tools take apageIdand several agent sessions sharing one server can work on different tabs. - Snapshots, screenshots and screencasts
take_snapshotreturns a text snapshot based on the accessibility tree, andtake_screenshotcaptures a page or element. Options set the default screenshot format (PNG, JPEG or WebP), compression quality and maximum width or height.screencast_startandscreencast_stoprecord a video with the built-in Chrome recorder; the older ffmpeg-based recorder is deprecated. - Performance traces and Core Web Vitals
performance_start_trace,performance_stop_traceandperformance_analyze_insightrecord a trace and return DevTools performance insights for LCP, INP and CLS. By default trace URLs are sent to the CrUX API to add real-user field data;--no-performance-cruxturns this off. - Lighthouse audits
lighthouse_auditreturns Lighthouse scores, failing audits and the DOM nodes they flag for accessibility, SEO, best practices and agentic browsing. Performance is excluded and handled by the trace tools. It runs in navigation or snapshot mode, emulates desktop or mobile, and saves full reports to disk. - Network and console inspection
list_network_requestsandget_network_requestexpose requests, headers and bodies, andlist_console_messagesandget_console_messagereturn console output with source-mapped stack traces. By default the server keeps requests and messages for the last three navigations per page;--maxNavigationSavedaccepts 1 to 25.--redactNetworkHeadersremoves headers considered sensitive before they reach the client. Parameters are in the tool reference. - Scripts, CSS and logpoints
evaluate_scriptruns JavaScript in a page or service worker and returns JSON-serializable results.get_css_stylesreturns matched rules, inline and inherited styles, custom properties and cascade wrappers such as @layer and @container for an element.set_logpoints, added in 1.13.0, logs expressions on given source lines without pausing, like logpoints in the DevTools Sources panel,. - Device and environment emulation
emulatesets color scheme, CPU throttling, extra HTTP headers, forced colors, geolocation, network conditions from Offline to Fast 4G, prefers-contrast, reduced motion, user agent and viewport, including mobile, touch and landscape.resize_pagesets the page size. - Memory debugging
take_heapsnapshotsaves a .heapsnapshot file of the page. Thirteen analysis tools, such ascompare_heapsnapshotsandget_heapsnapshot_retainers, require the--memoryDebuggingflag. Since 1.12.0 snapshots can be analyzed without a browser connection. - Optional tool categories Further groups are off by default: network mocks (
--categoryNetworkMocks), extension management for unpacked extensions (--categoryExtensions), Progressive Web App install and launch tools that need a pipe connection (--categoryPwa), a virtual WebAuthn authenticator for passkey tests (--categoryWebauthn), WebMCP tools that require Chrome 150 with the WebMCP feature flag, and third-party developer tools that a web app exposes through adevtoolstooldiscoveryevent. - Browser launch options By default the server starts stable Chrome with its own persistent profile in
~/.cache/chrome-devtools-mcp/chrome-profile.--isolateduses a temporary profile that is deleted on close,--headlesshides the UI,--channelselects canary, dev, beta or stable, and--executablePathpoints to another Chrome-based binary. Viewport, proxy and extra Chrome arguments are also configurable; all options are listed in the configuration guide. - Connecting to a running Chrome With
--autoConnectand Chrome 144 or later, the server attaches to a browser the user has started after remote debugging was enabled atchrome://inspect/#remote-debugging. Chrome asks for permission on every connection request. Alternatively--browserUrlor--wsEndpoint(with optional--wsHeaders) connects to a debugging port; the advanced usage guide warns that any application on the machine can control a browser through an open debugging port. - Access restrictions
--blockedUrlPatternand--allowedUrlPattern(Chrome 149 or later) restrict navigations and requests with URL patterns.--no-javascript-evaluationdisables evaluation tools and script URLs, and--no-file-navigationsblocks file: URLs; the documentation states that neither is a sandbox. Without MCP roots support in the client, file tools are limited to the OS temp directory unless--filesystemRootis set. - Configuration files and live reload Options can live in a JSON file passed with
--config, acd4a.config.jsonin the plugin data directory, or a globalcd4a/config.json; command-line flags take precedence.--watchConfigapplies most changes without a restart. The documentation warns that the file and its folder must not be writable by the agent, since it controls security-sensitive settings. - Slim mode
--slimreduces the server to three tools,navigate,evaluateandscreenshot, for basic browser tasks. The slim tool reference documents the parameters. - Command-line interface After
npm i chrome-devtools-mcp@latest -g, thechrome-devtoolscommand calls the same tools from a terminal, for examplechrome-devtools navigate_page 1 --urlorchrome-devtools take_screenshot 1 --filePath. It talks to a background daemon, starts headless and isolated by default, and can print JSON. The CLI guide notes that file access is unrestricted by default and limited with--workspace.
Where Chrome DevTools MCP fits
Verifying a generated fix in the browser
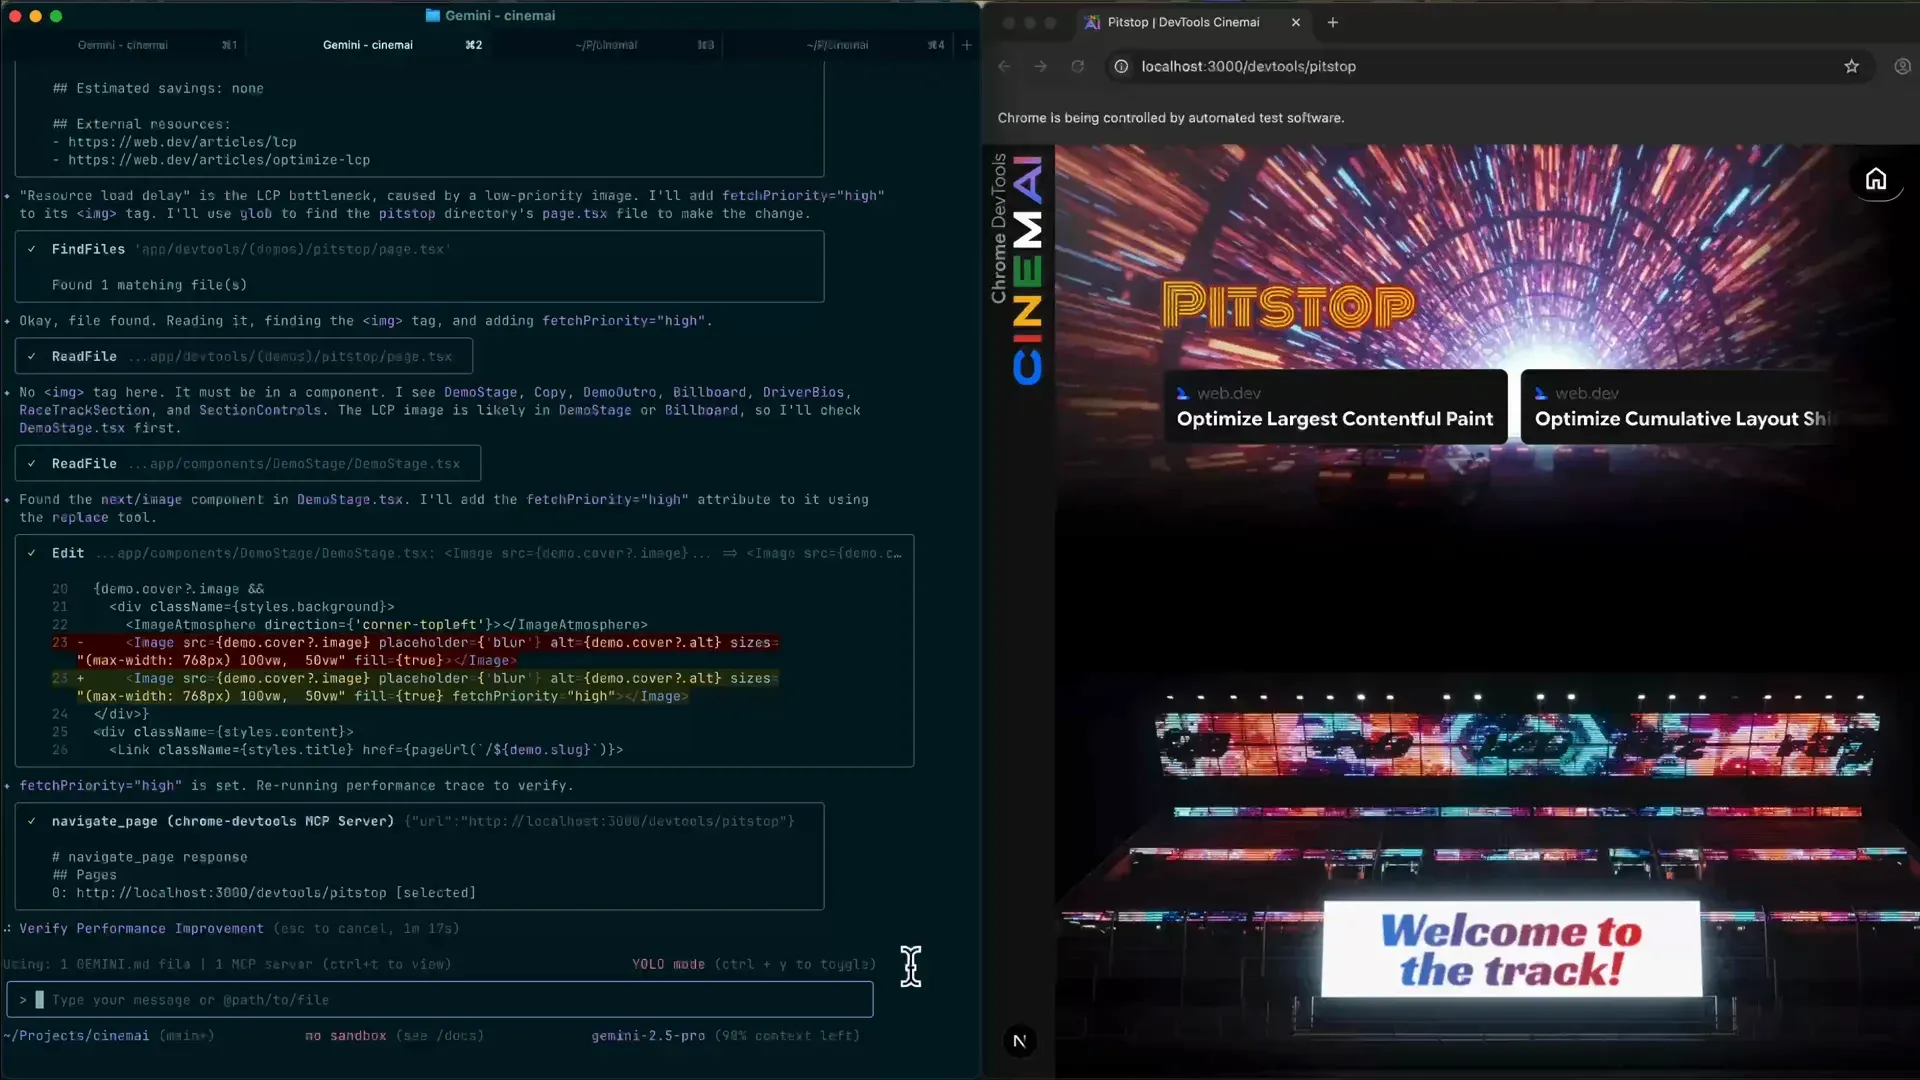
The launch post describes an agent that writes a fix and then opens the page in Chrome through the server to confirm that the change works. Its demo video shows Gemini CLI recording a trace of a local Next.js page, finding a low-priority LCP image, adding fetchPriority="high" in the component and navigating to the page again to re-run the trace. Similar MCP servers for browser control include MCP Playwright Server and MCP Puppeteer Server.
Investigating network and console errors
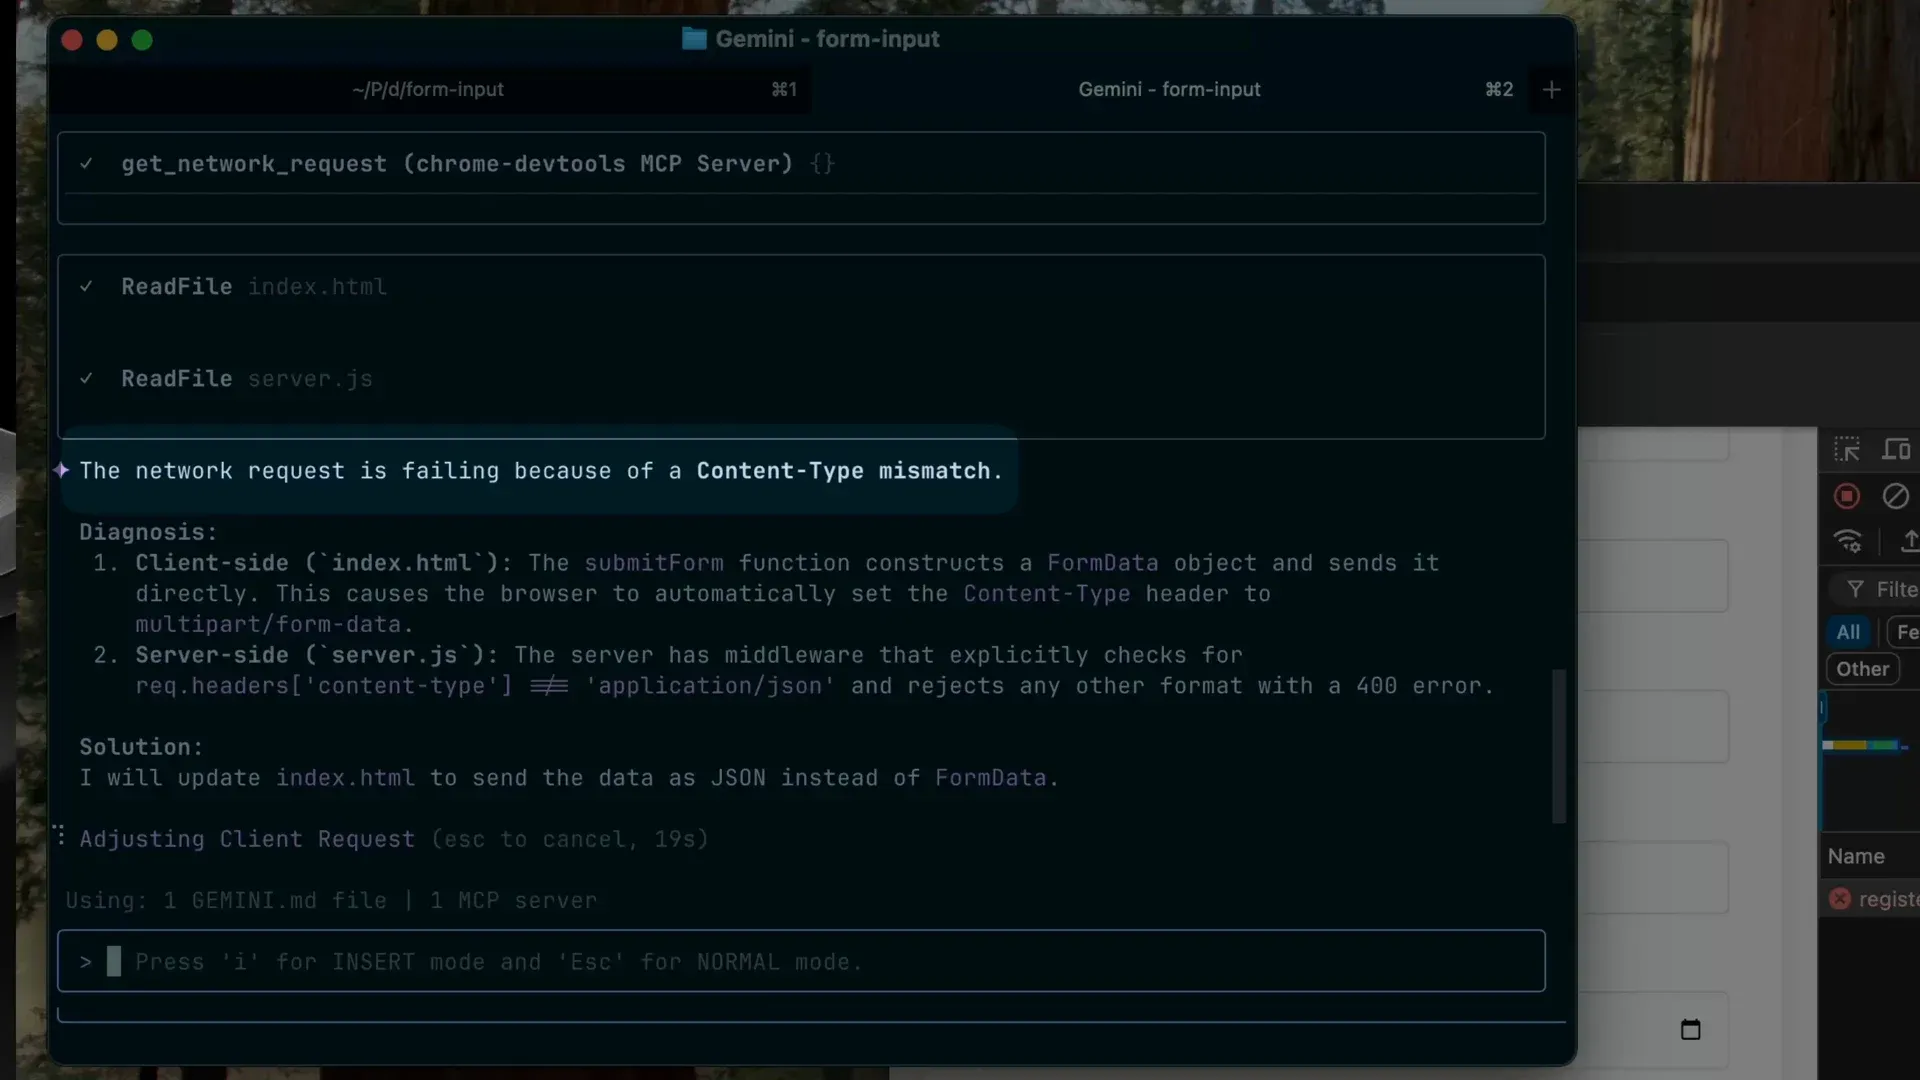
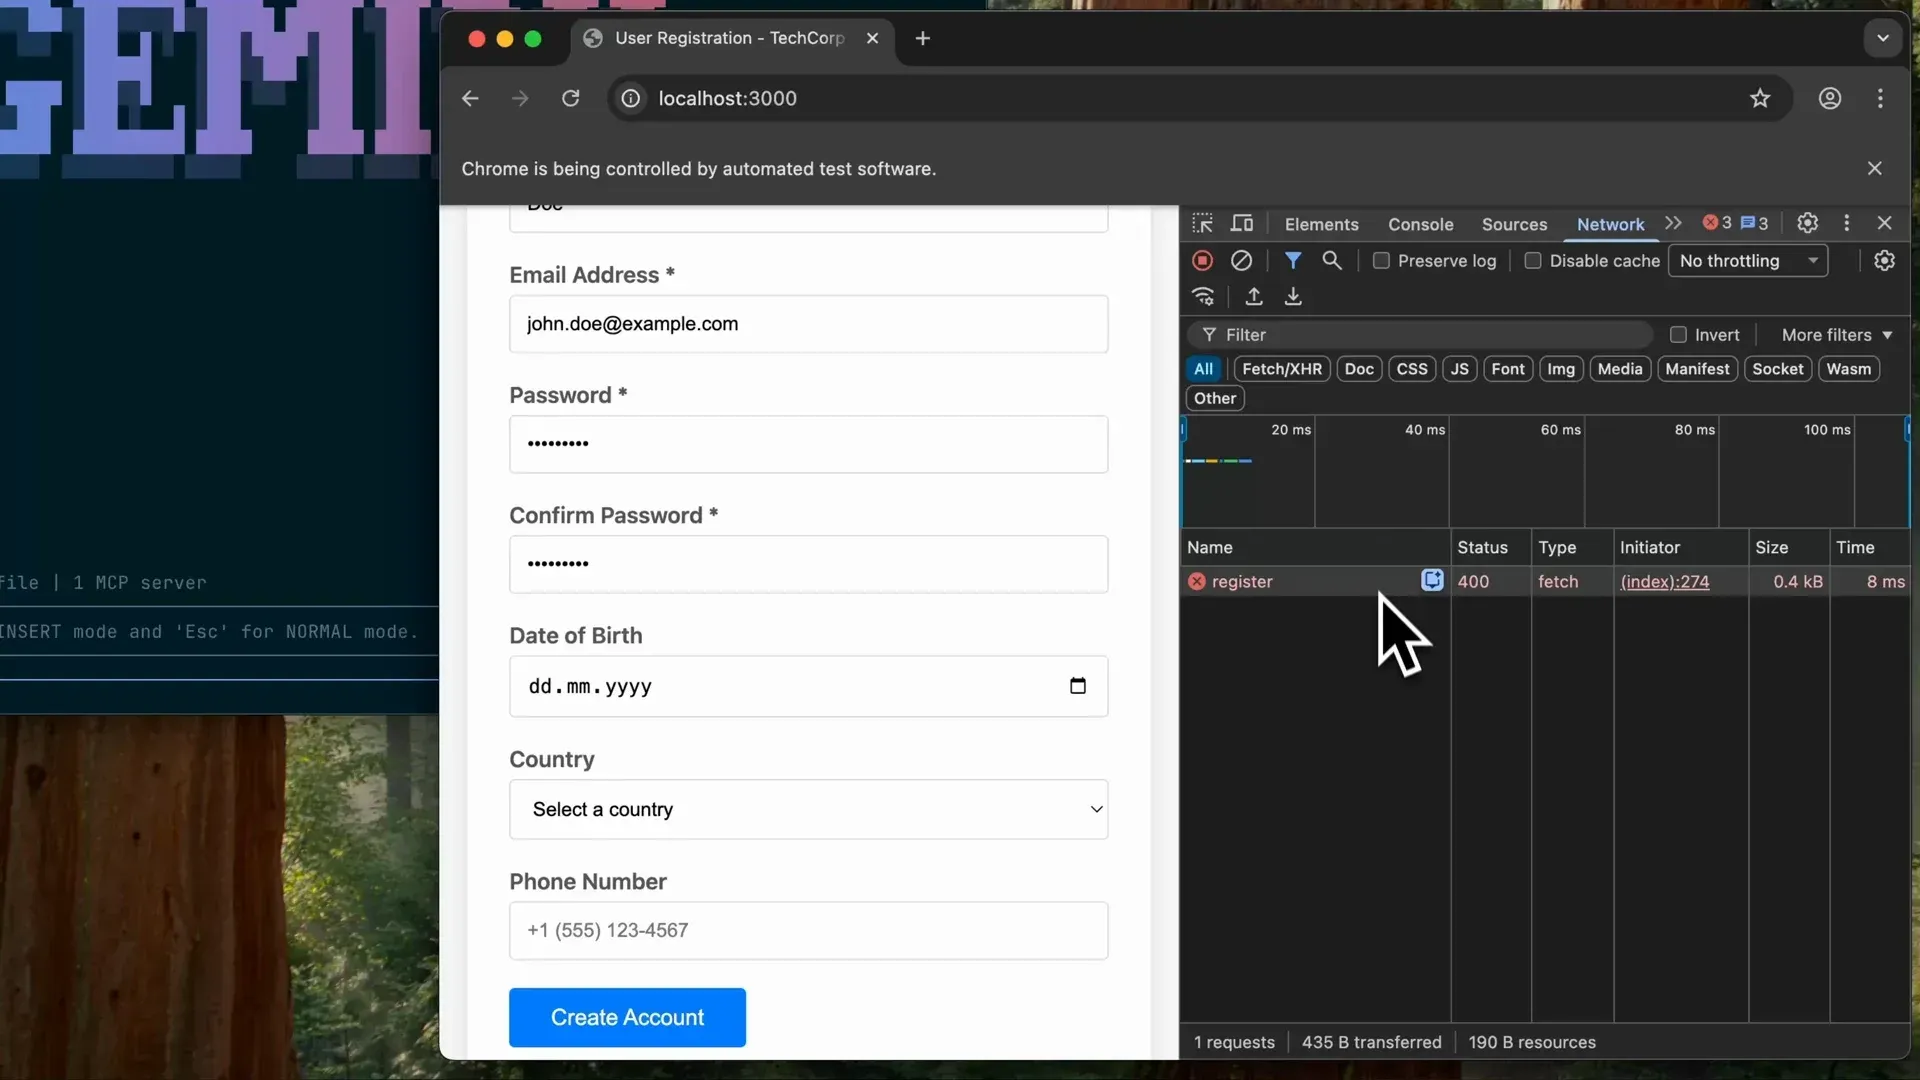
Agents read failed requests with list_network_requests and get_network_request and inspect console logs to find causes such as CORS errors. With --autoConnect, a developer can select a failing request in the Network panel or an element in the Elements panel of their own Chrome window and ask the agent to investigate it; the auto-connect announcement shows a form submission rejected with HTTP 400 that the agent traces to a Content-Type mismatch between client and server code.
Performance analysis and LCP work
A prompt such as checking the performance of a URL makes the agent start a trace, stop it after load and query individual insights with performance_analyze_insight. Field data from CrUX is added unless disabled. The bundled debug-optimize-lcp skill describes how the agent works through Largest Contentful Paint problems with these tools.
Accessibility and SEO checks with Lighthouse
The Lighthouse use case on Chrome for Developers lists prompts that run an accessibility audit and suggest fixes for low-contrast elements, or run an SEO audit and check that images have descriptive alt text. lighthouse_audit returns the failing audits with the flagged DOM nodes, and the a11y-debugging skill covers accessibility fixes.
Emulating users, devices and locations
The emulation use case covers responsive layouts, geolocation and user flows. Example prompts open a site with a mobile viewport and check the navigation menu, or simulate a location in Berlin and check which branch a store locator shows. fill_form, click and upload_file reproduce multi-step flows such as sign-ups, and the cookie-debugging skill covers sessions and authentication.
Scripting and embedding the browser tools
The chrome-devtools CLI lets an agent or a shell script call the tools without an MCP client, with the chrome-devtools-cli skill teaching agents its syntax. For vendors building agent products, the README points to Chrome DevTools for agents as the basis for an integrated browser subagent and cites the Gemini CLI browser agent as a reference implementation. Related agent browser projects listed on iThub include Lightpanda and Browser Use.
Install
npx -y chrome-devtools-mcp@latestReviews of Chrome DevTools MCP
Be the first to share your experience with Chrome DevTools MCP.
Write a review
Loading review form…
Found Chrome DevTools MCP useful? Upvote it todayYour vote helps other IT teams find it in the daily ranking.