

What is Scanopy?
Scanopy is a network discovery and documentation tool developed by Scanopy LLC and published on GitHub. A daemon scans the networks it can reach on a schedule, and the server turns each scan into four topology views: L2 (physical links between switch ports), L3 (subnets and the hosts on them), workloads (hypervisors, VMs and containers) and applications (services grouped by application with their dependencies). The same data feeds a searchable device inventory with addresses, interfaces, open ports, detected services and SNMP hardware details. The project describes itself with the line "Network diagrams that update themselves".
The project was first released as v0.1.0 in September 2025 under the name NetVisor. Release v0.12.0 in December 2025 renamed it to Scanopy; the migration notes state that the old name conflicted with an existing networking product and that the Docker images moved from the mayanayza/netvisor names to the Scanopy images. The current release is v0.19.6, published November 4, 2026. It adds libvirt discovery over SSH so KVM and QEMU hosts and their guests appear in the topology, splits SSH credentials into logins and scripts, groups credentials by category and adds entity tooltips across the app. It also fixes SSH logins using the wrong port and VMs being marked unreachable when the host NIC is not visible. Release v0.19.0 redesigned the topology view with simplified cards, device glyphs and a more condensed layout engine.
The architecture has three parts, documented in the architecture reference. The server stores discovery data in PostgreSQL, serves the REST API and web UI, generates topology views, schedules discoveries and pushes live progress to the browser through Server-Sent Events. Daemons run on the networks being scanned; by default they poll the server and need only outbound connections (DaemonPoll mode), while ServerPoll mode lets the server connect to a daemon on port 60073 for DMZ placements. The UI is bundled as static files in the server. The codebase is written mainly in Rust with a Svelte and TypeScript front end.
Distribution covers several paths. The Community Edition installs with an official Docker Compose file that starts the server on port 60072, PostgreSQL 17 and an integrated daemon with host networking. The server is also published as a Linux binary for amd64 and arm64 to run under systemd, and the release assets include daemon binaries for Linux, macOS (Intel and Apple Silicon), Windows (EXE and MSI) and FreeBSD. The README also points to a Proxmox VE community helper script for an LXC and to Unraid Community Applications templates. Scanopy Cloud is the hosted alternative, where Scanopy runs the server in the United States and customers install only the daemons.
The Community Edition is licensed under AGPL-3.0, an OSI-approved copyleft license. The Commercial Edition (Self-Hosted Standard, Self-Hosted Plus and Enterprise) provides a commercial license for organizations that cannot meet AGPL-3.0 terms, with higher site and seat limits, Confluence export, invoice billing and support. The limitations page lists documented boundaries: IPv4 only, subnets larger than /10 are skipped, remote routed subnets yield no MAC addresses and only hosts with open ports, SNMP is poll-based without trap handling or custom MIB loading, and Docker Desktop on macOS and Windows cannot run the integrated daemon. The project states that it focuses on network documentation and does not provide asset lifecycle management or procurement tracking.
Scanopy screenshots
Explore the interface. Open a screenshot to view it at full size.
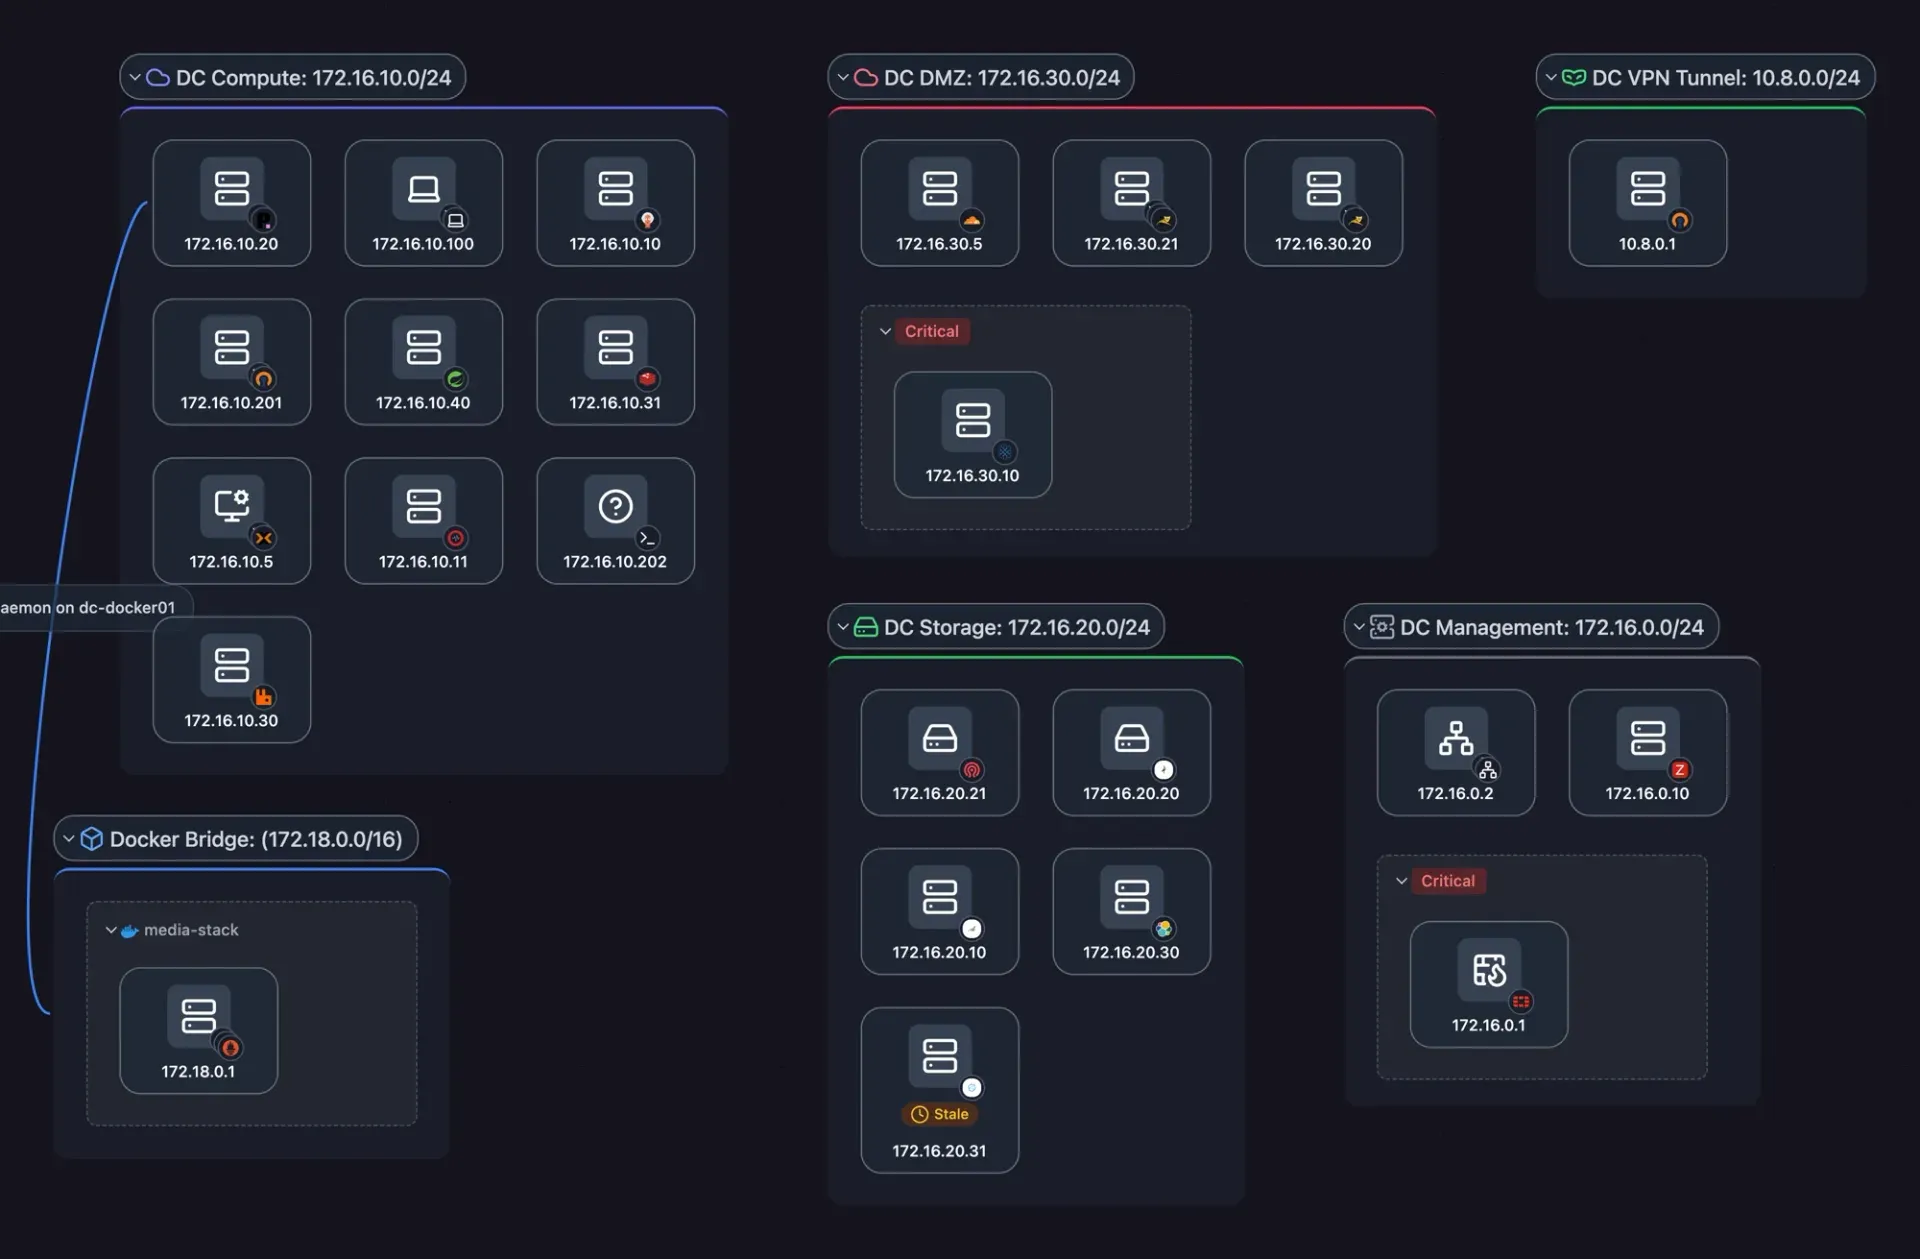
L3 logical view from the README: sample subnets drawn as containers with the hosts that have addresses in them.
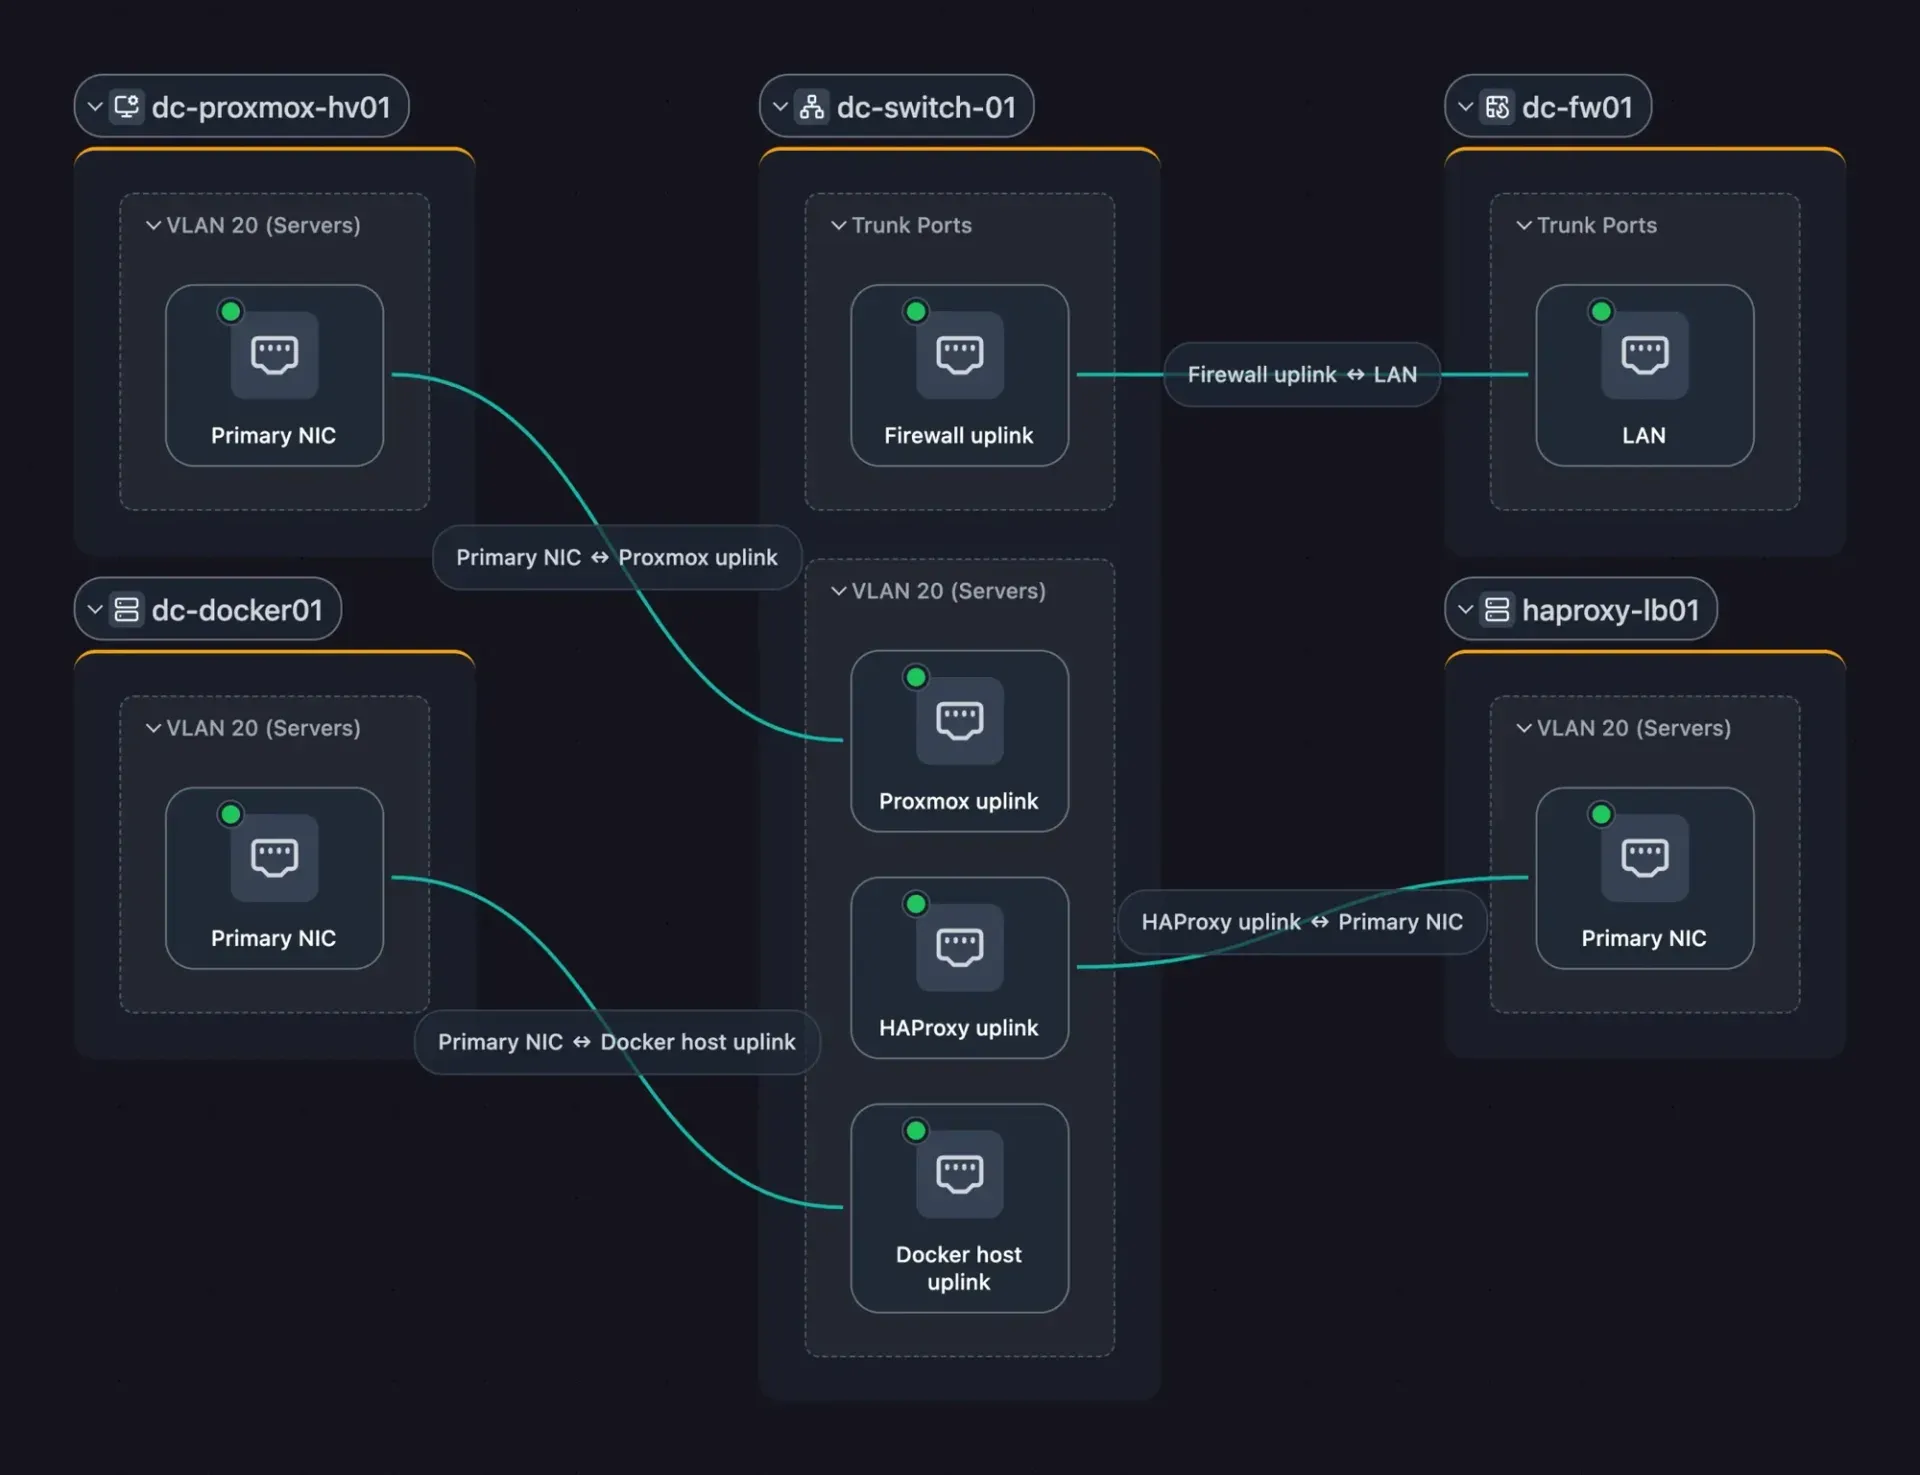
L2 physical view from the README: switch trunk and VLAN 20 ports linked to the network interfaces of sample hosts.
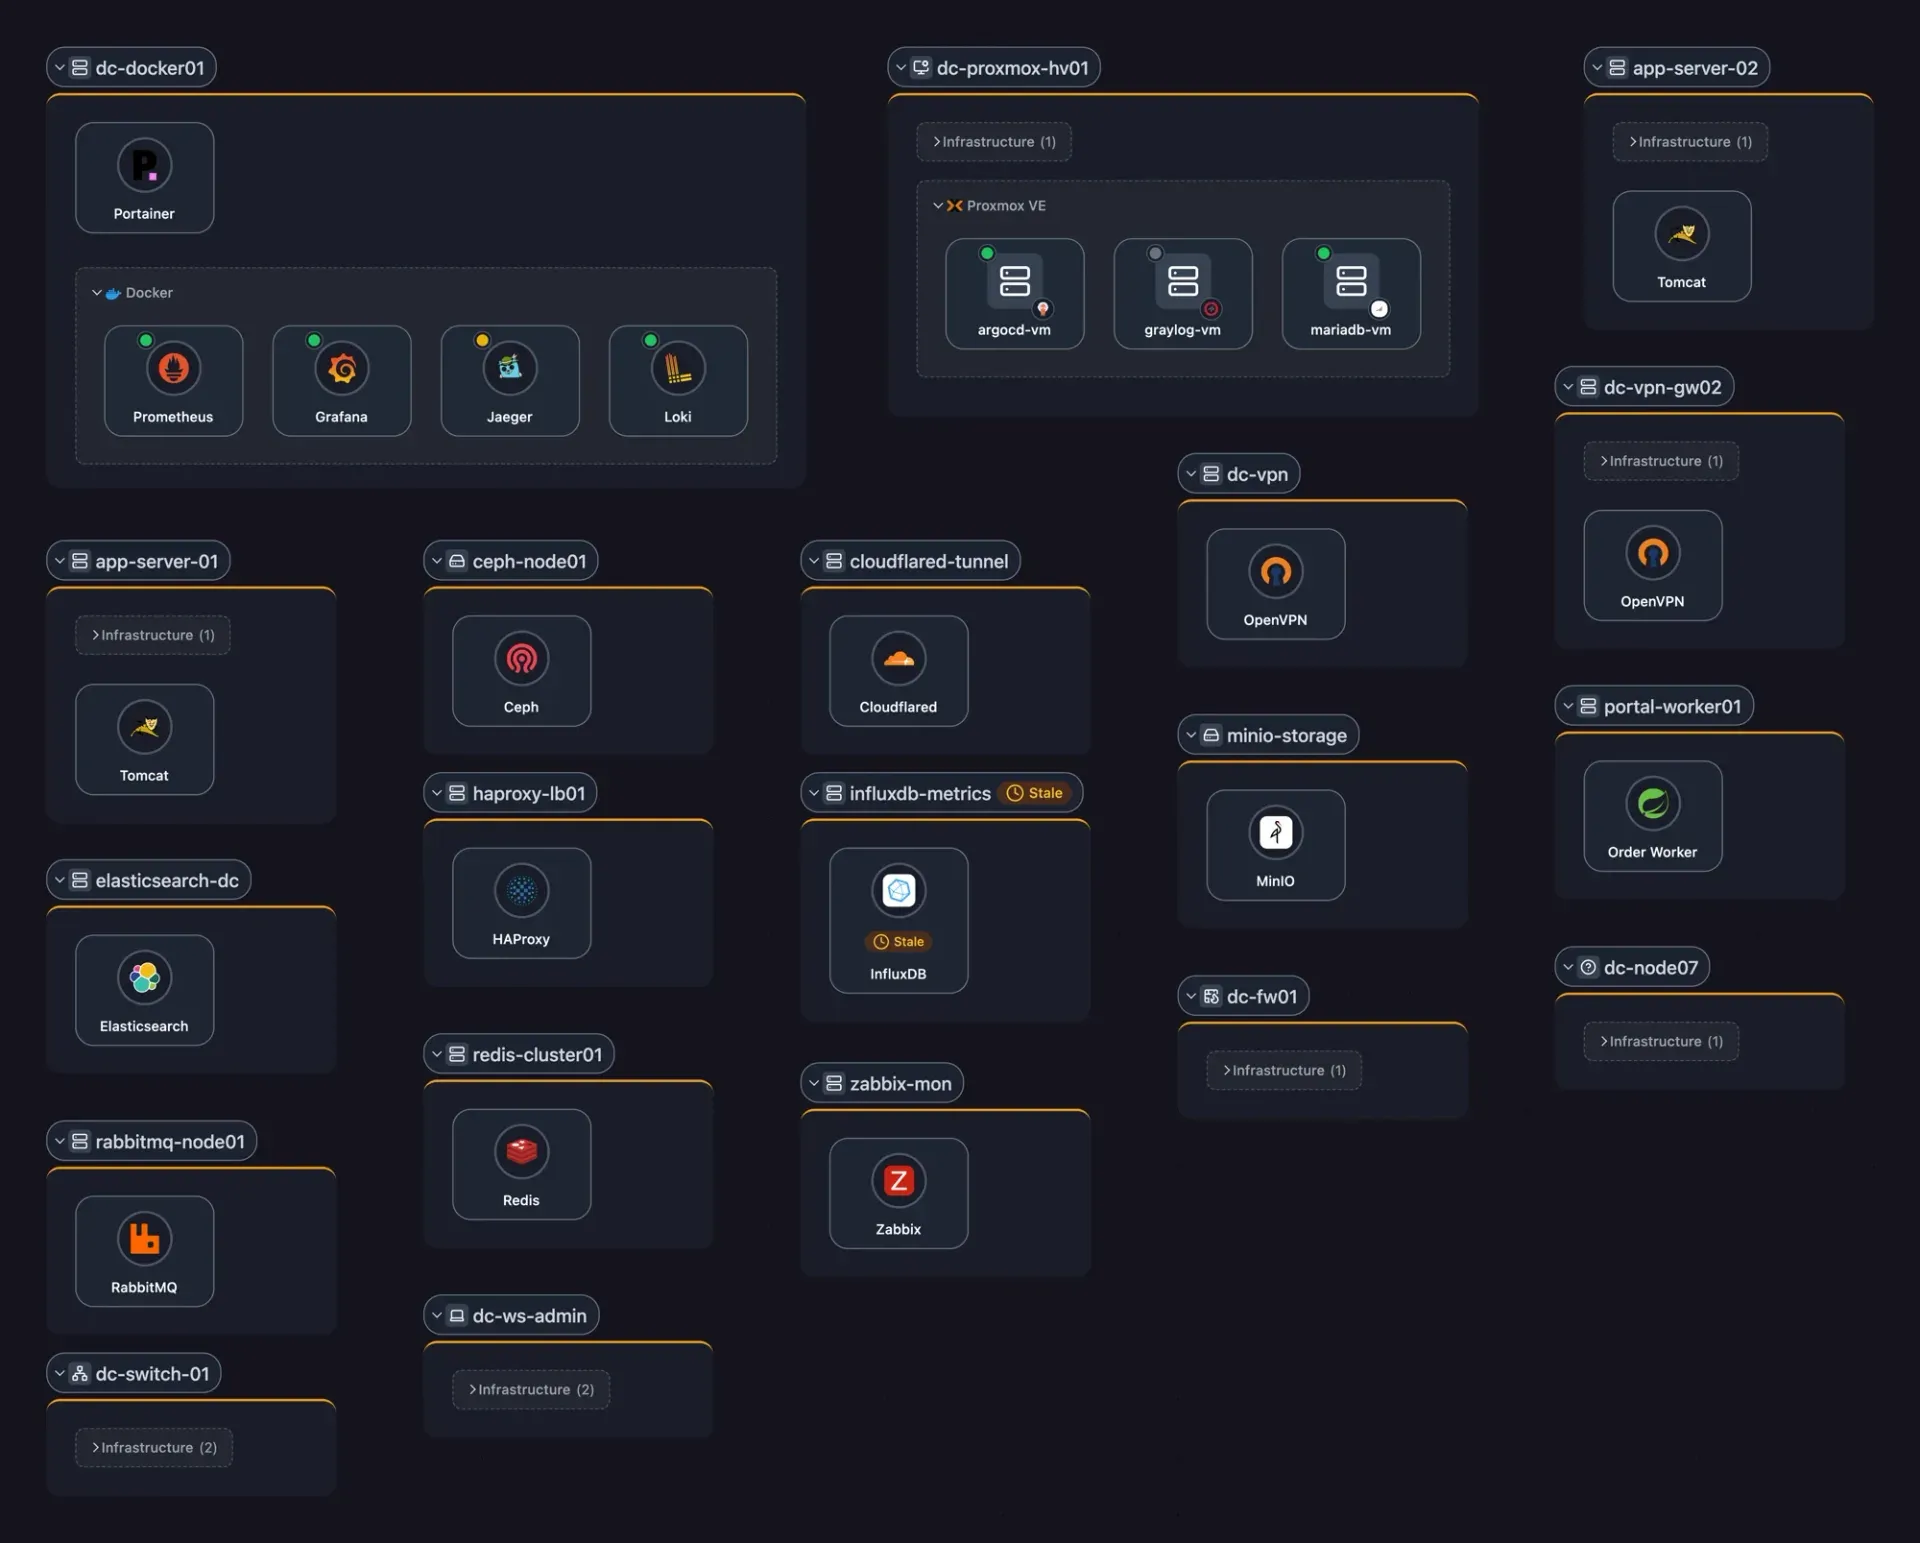
Workloads view from the README: sample hosts containing Docker containers, Proxmox VE virtual machines and detected services.
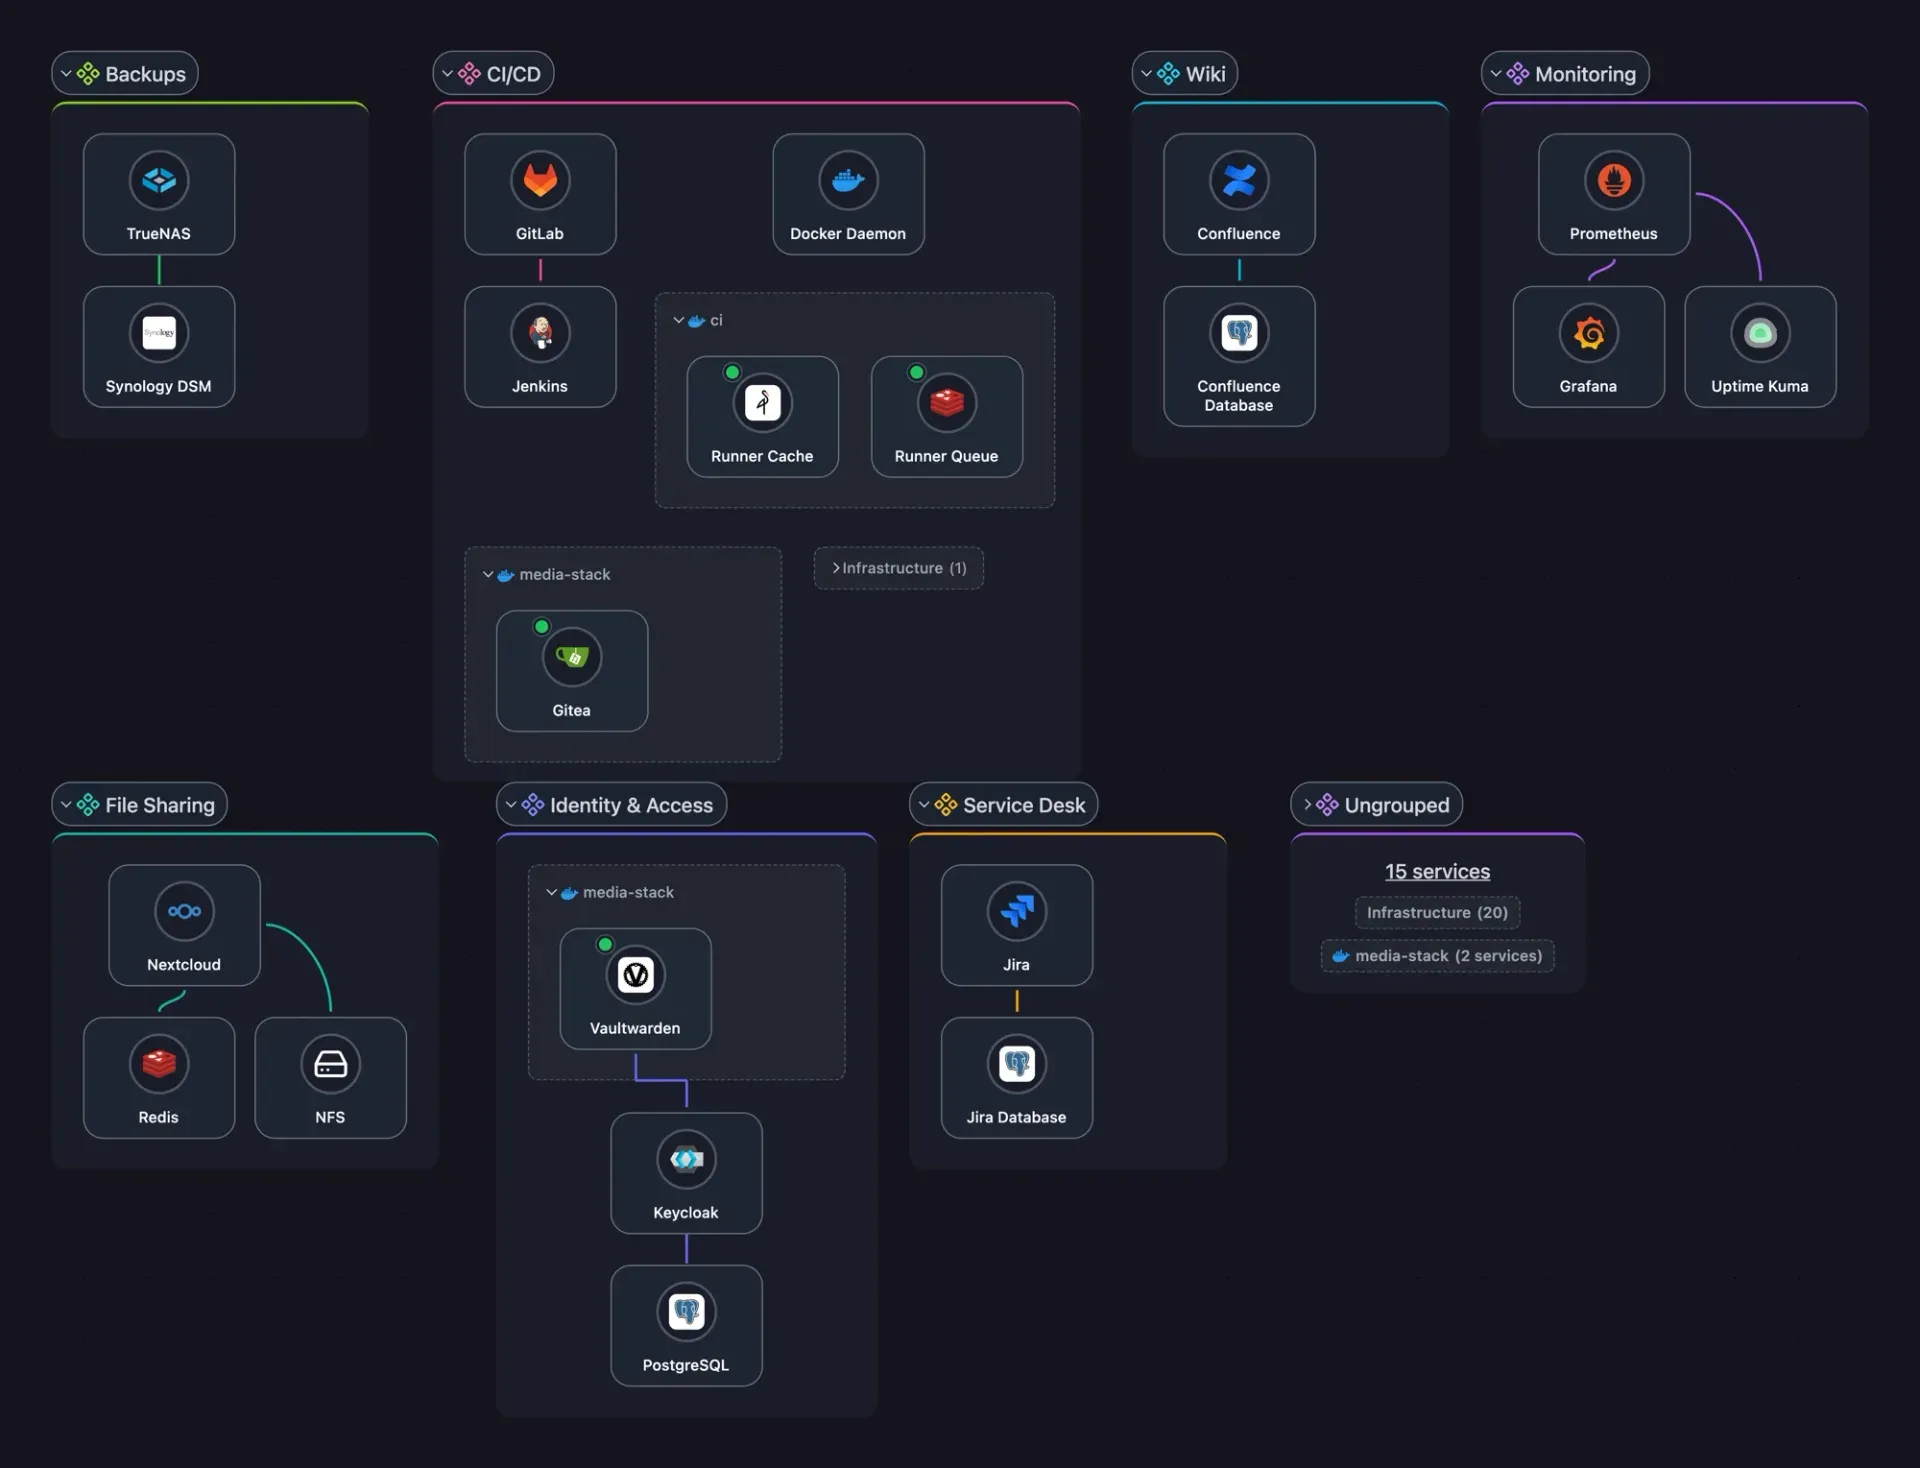
Applications view from the README: sample services grouped by application tag with dependency lines between them.
Source: official Scanopy project page.
Key capabilities
- L2 physical topology The L2 view shows which device is connected to which port on which switch. Links come from LLDP and CDP neighbor tables read over SNMP, over gNMI, or from a network controller API such as UniFi, plus switch forwarding tables. Devices that report no neighbor data, such as unmanaged switches and most endpoints, do not appear in this view, as the topology documentation explains.
- L3 logical topology The default view draws each discovered subnet as a container and shows every host inside each subnet where it has an address, so multi-homed hosts appear as bridges between segments. Docker and Podman bridge networks appear as their own subnets, with overlays linking them back to the container host. Dependencies configured with port-level detail can be overlaid on this view.
- Workload mapping The workloads view nests VMs inside their hypervisor and containers inside the runtime that runs them, without connection lines. Docker and Podman containers populate when a matching credential is configured, Proxmox VE VMs and LXC containers when a Proxmox credential is assigned, and libvirt KVM/QEMU guests over SSH since v0.19.6. VMs on vCenter or ESXi are linked through a manual virtualization assignment UI.
- Application dependency mapping Applications are tags in a built-in Application tag group; tagging a server once places its services in that application. Users draw dependencies between services as either an ordered request path or a hub-and-spoke pattern. Generic infrastructure services such as SSH, NTP and DHCP are hidden by default, and untagged services collect in an Ungrouped container.
- Device inventory Every discovered host is listed with IP and MAC addresses, interfaces, open ports, services and SNMP hardware facts such as manufacturer, model, serial number and firmware. The inventory supports search with the slash key, filtering by site or tag, CSV export and REST API access. Release v0.19.5 added a workflow to confirm or merge inferred devices and to edit device facts in place.
- Service detection The README lists more than 410 service definitions covering databases, web servers, printers, cameras and industrial protocols including Modbus TCP, EtherNet/IP, OPC UA and BACnet. Detection matches open ports, HTTP endpoints, headers, MAC vendors and controller-reported device types, and each match carries a confidence level from low to certain. The service detection reference notes that services on non-standard ports or behind authentication may not be detected.
- Discovery pipeline A scan runs ARP discovery across configured subnets, then a deep scan of each host with TCP and UDP port scans, reverse DNS lookups, SNMP queries when credentials exist and service matching, followed by a grace period for late ARP replies. Each daemon has its own schedule, rate and subnet scope. Raw socket printer ports 9100 to 9107 are skipped by default to avoid printing on JetDirect printers.
- Discovery integrations Credentials let a daemon read Docker, Podman, Proxmox VE, UniFi Controller, Aruba Instant On, SNMP, SSH and gNMI sources, and Wake-on-LAN is also supported. Each integration writes into the same host record as the network scan, so one machine appears once rather than once per source. SNMPv3 is supported in AuthPriv mode with SHA-1 or SHA-256, alongside SNMPv1 and v2c.
- VLAN and subnet inventory Scanopy reads VLAN tables from switches over SNMP, shows native and tagged VLANs per port and links each VLAN to its subnets. Since v0.19.0 UniFi networks are recorded as VLANs and subnets as well. VLAN last-seen times refresh on each scan that reports them.
- Scan digests and snapshots After each scheduled scan an email digest can list new, stale and changed hosts, which requires SMTP on self-hosted servers. Snapshots record the network map on a date; a self-hosted server keeps them for 90 days by default, adjustable with an environment variable. Cloud plans retain snapshots for 30 or 90 days depending on the plan.
- Sharing, embeds and exports Read-only topology links can carry a password and an expiry date and open without a Scanopy account, and live maps can be embedded in a wiki. Export formats listed on the pricing page are PNG, SVG, PDF, HTML and Mermaid, with Confluence, draw.io and Visio on higher cloud plans and the commercial self-hosted tiers.
- Multi-user access and SSO Admin, member and viewer roles can be scoped per site. Self-hosted servers support single sign-on through OIDC providers such as Authentik, Keycloak, Auth0 or Okta, and SAML is marked as coming soon on the pricing page. A Community, Standard or Plus server holds one organization, while Enterprise servers can hold several.
- REST API and metrics The API reference covers hosts, services, subnets, VLANs, topologies, snapshots, shares, tags and more, authenticated with user API keys or a session cookie and limited to 300 requests per minute. A metrics endpoint at /api/metrics can be scraped by Prometheus 2.47 or later or Grafana Alloy with a bearer token. An MCP server for AI assistants is listed as coming soon, with a beta sign-up added in v0.19.5.
- Docker Compose installation The official compose file runs the server, PostgreSQL 17 and an integrated daemon; requirements are Docker Engine 20.10 or later and Docker Compose V2. The daemon container uses host networking, runs privileged and mounts the Docker socket read-only for the Docker integration. The installation guide recommends setting a PostgreSQL password and the public URL in an .env file before the first start.
- Native server and daemon installs The server binary runs under systemd with an external PostgreSQL database. Daemons are created in the UI wizard, which generates an install command or compose file carrying the daemon's API key; the scanopy-daemon install command registers a systemd, launchd, Windows Service Control Manager or FreeBSD rc.d service. Docker Desktop hosts on macOS and Windows must use the native daemon because containers there cannot see the host network.
- Outbound connections of a self-hosted server Twice a day the server checks api.github.com for new releases, which can be disabled with SCANOPY_DISABLE_UPDATE_CHECK. Licensed servers download daemon installers through get.scanopy.net and docker.scanopy.net unless the gateway is disabled, while Community Edition servers always download from GitHub. Self-Hosted Plus and Enterprise use offline license keys for air-gapped networks.
- Community Edition and commercial tiers The free AGPL-3.0 Community Edition covers one site and one user seat. Self-Hosted Standard costs $4,000 per year for 25 seats and 50 sites, and Self-Hosted Plus $7,000 per year for 50 seats, 100 sites and air-gapped deployment; both cover one production and two non-production servers. When a commercial license expires, the server goes read-only until the key is replaced.
- Scanopy Cloud plans The hosted service has a Free plan with one seat and one site limited to inventory and discovery features, Pro at $79.99 per month billed yearly with three sites and topology views, Business at $199.99 per month billed yearly with five seats and 15 sites, and a custom Enterprise plan. Pricing is flat rate without per-device fees, and paid plans include a 14-day trial without a credit card. Scanopy Cloud is hosted in the United States.
Where Scanopy fits
Documenting a network that changes
Scanopy is described as a replacement for hand-drawn draw.io or Visio diagrams. A daemon rescans on its own schedule, and each scan updates the L2, L3, workload and application views, and the inventory marks hosts that later scans no longer see as stale. Snapshots keep dated copies of the map for comparison. The quick start walks through the first discovery, which starts automatically after the first account is created on a Docker Compose install.
Mapping multi-site and segmented networks
Each daemon scans the subnets it can reach, so the documentation recommends one daemon per network segment because ARP does not cross routers and remote subnets return only hosts with open ports. Hosts can be filtered by site, and user roles can be scoped per site. Guides cover scanning isolated networks from one host, VPN networks and MACVLAN-isolated daemon networking. DaemonPoll mode needs only outbound connections from the daemon, which suits sites behind NAT.
Inventory and shadow IT discovery
The device inventory lists every responding host with addresses, ports, services and hardware facts, and the scan digest email reports new, stale and changed hosts after each scheduled run. The project lists shadow IT discovery, plant and OT networks with industrial protocols such as Modbus TCP and BACnet, and network handover between staff among its documented use cases. Inventory data can be exported to CSV or read through the REST API.
Homelab and container hosts
The project started from homelab network documentation, and the Community Edition is free for one site and one user. The Docker and Podman integrations read container runtimes directly, so containers on internal bridge networks appear even without published ports, and Proxmox VE, libvirt and UniFi integrations fill in VMs and network gear. Comparable diagram output from a hand-maintained YAML inventory is available with homelab-diagram, while Scanopy derives its diagram from scans.
Client documentation for MSPs
The README lists MSPs as a target group: each client can be a site, staff can be limited to their own sites, and read-only share links with optional passwords and expiry give a client a current map without a Scanopy account. The Business cloud plan includes 15 sites with extra sites billed per month, and separate organizations per client come with Enterprise. Exports to Confluence, draw.io and Visio are part of the Business plan and the commercial self-hosted tiers.
Compliance evidence and integration with monitoring
Scanopy positions its dated snapshots and segmentation views as documentation for audits under NIS2, ISO 27001, HIPAA and CMMC. Self-hosted editions keep discovery data, topology and credentials on the operator's infrastructure, and the commercial FAQ states that Scanopy receives none of that data. Operational metrics can be scraped into Prometheus following the Prometheus guide, and diagrams can be exported as Mermaid text.
Install
curl -O https://raw.githubusercontent.com/scanopy/scanopy/refs/heads/main/docker-compose.yml && docker compose up -dReviews of Scanopy
Be the first to share your experience with Scanopy.
Write a review
Loading review form…
Related to Scanopy
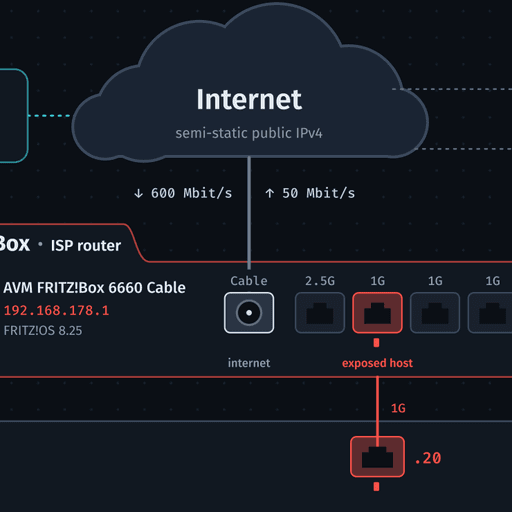 homelab-diagramhomelab-diagram is an MIT-licensed Python script that draws a detailed homelab network diagram (VLANs, switch ports, link speeds, servers, containers, storage) from inventory.yaml. Its layout is hand-placed for one specific lab.
 MermaidOpen-source JavaScript diagramming library: write flowcharts, sequence, ER, Gantt and many other diagrams as Markdown-like text and render them to SVG in the browser, in docs and in build pipelines.