
What is homelab-diagram?
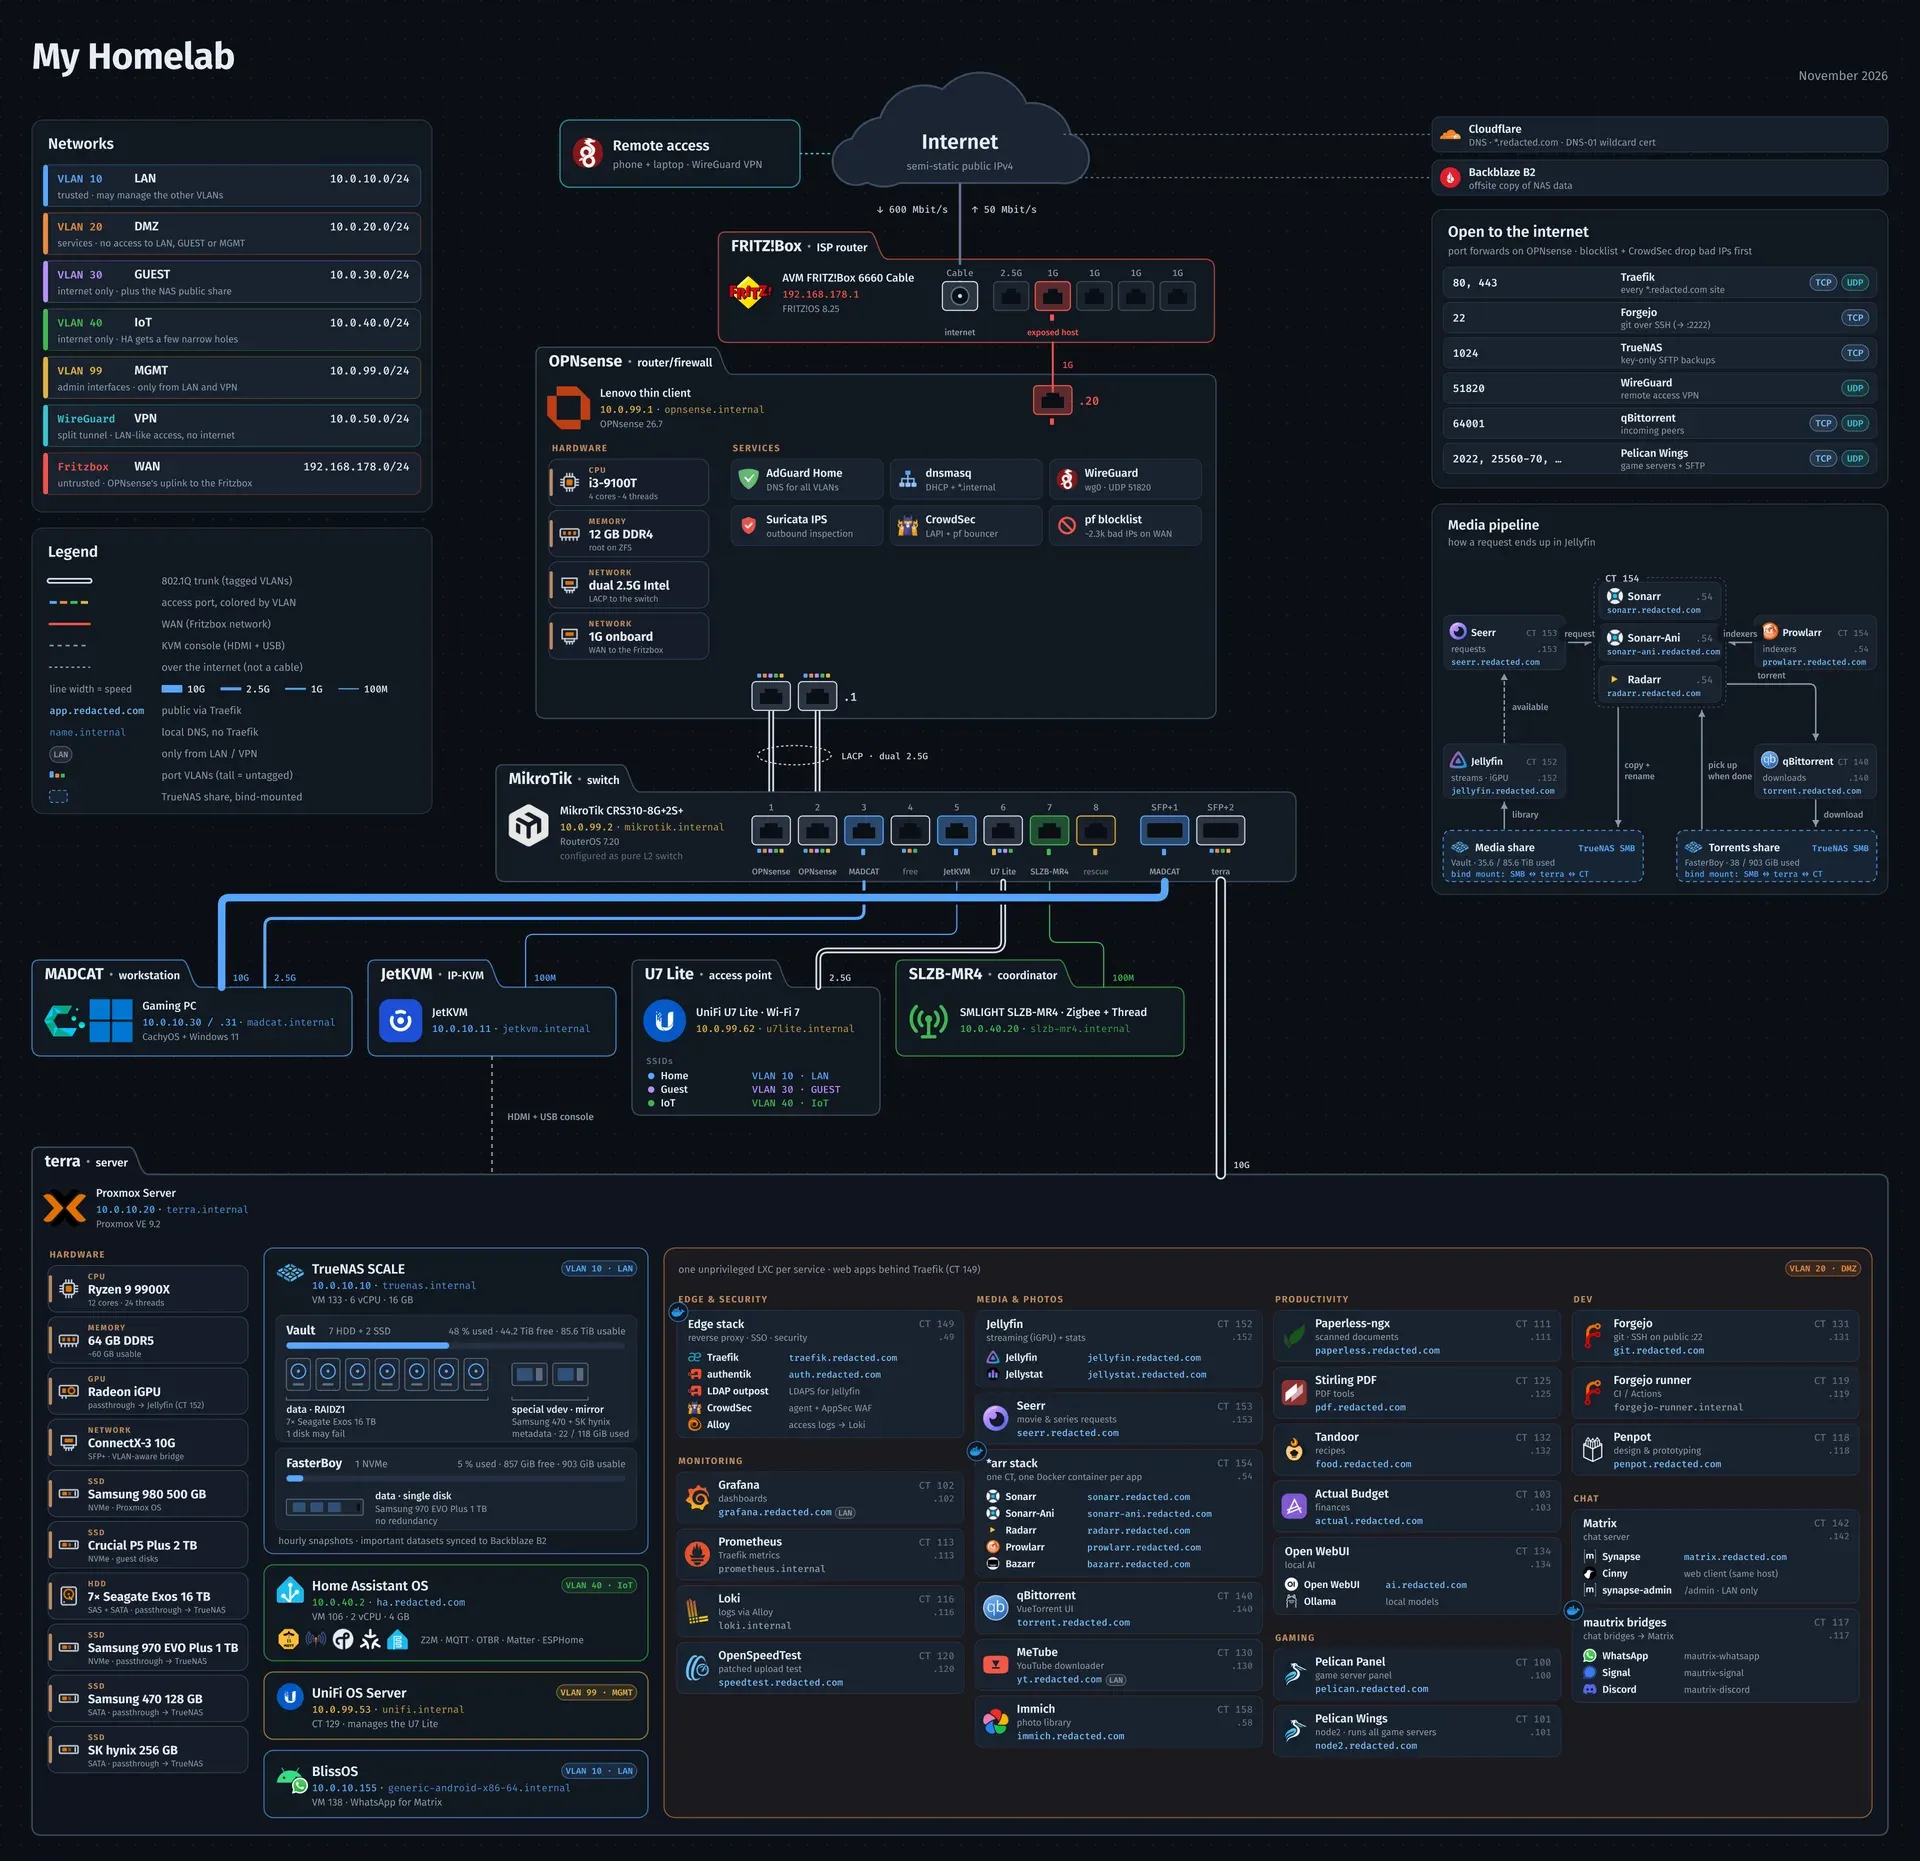
homelab-diagram is a small open-source project published on GitHub as Goblinmine/homelab-diagram. It contains the script behind a network diagram of the author's homelab that was posted on the r/homelab subreddit. The script reads a YAML file that describes the lab and draws one large diagram in the dark, card-based style common on that subreddit, written as SVG and converted to PNG.
The README states clearly that this is not a general tool. The content of the picture comes from inventory.yaml, but the layout, meaning the position of every box, port and cable, is hand-placed in build.py for exactly the author's network. Using it for another lab means changing the inventory and then moving coordinates in the code. The project describes itself as a starting point rather than a finished product.
The README also states that the code was written by AI: the author built it with Claude in Claude Code over about 60 rounds of feedback on rendered images. The repository includes a CLAUDE.md file that tells a coding agent how to adapt the diagram to someone else's lab: how the code is structured, which parts of the layout are hardcoded, which questions to ask about the network, the render-and-check loop and the design rules the diagram follows.
Technically the project consists of three Python files and a set of icons. build.py (about 900 lines) draws the SVG on a logical canvas 2400 units wide, embeds icons as base64 and calls rsvg-convert from librsvg to produce the PNG. fetch_icons.py downloads service logos from the homarr-labs dashboard-icons collection, since those logos belong to their projects and are not included. Only the author's own glyph icons for CPU, RAM, SSD, HDD, GPU, NIC and similar parts are in the repository. Requirements are Python 3 with PyYAML, optionally Pillow, librsvg and the Fira Sans and Fira Code fonts.
The code and the glyph icons are released under the MIT license; the Fira fonts use the SIL Open Font License and are not bundled. The repository was created in November 2026 and has no tagged releases; it is used by cloning the source. General-purpose diagramming tools on iThub include draw.io and Mermaid. The example lab itself runs on Proxmox.
homelab-diagram screenshots
Explore the interface. Open a screenshot to view it at full size.
Key capabilities
- YAML inventory as the single content source
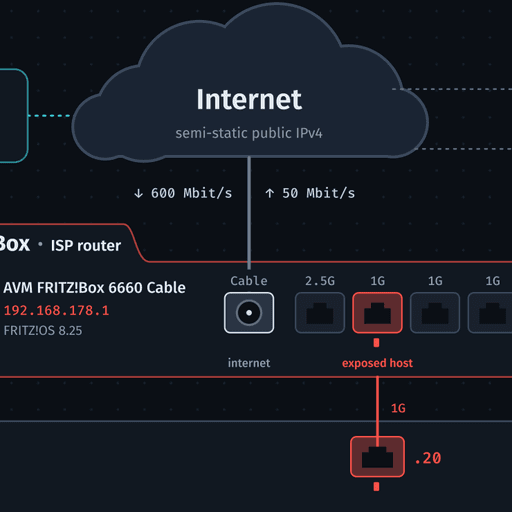
inventory.yamlholds everything the picture shows: VLANs, devices, switch ports, port forwards, server hardware, virtual machines and containers, storage pools and the media pipeline. Texts, IP addresses, ports, VLAN colors and container groups are all edited there, and the schema can be extended whenbuild.pyis taught the new fields. - Internet edge chain The top of the diagram shows the path from the internet through the ISP router, drawn with its real ports including a coax cable port, to the firewall and the core switch. Download and upload speeds and cloud services such as DNS providers and offsite backup targets are shown as dotted logical links.
- Switch ports with VLAN markers Every switch port is drawn with its connected device and the VLANs on it: a tall bar marks the untagged VLAN and short bars mark tagged VLANs. The default layout assumes one switch with 8 RJ45 ports and 2 SFP+ ports in one row.
- Cable width as link speed The line width of each cable represents the negotiated link speed (10G, 2.5G, 1G or 100M), with a small speed label where the cable reaches a device. Trunks carrying tagged VLANs are drawn as a white cable with a dark core, while access links use the VLAN's color.
- Device cards Physical devices use a folder-tab card with name and type on the tab and icon, full model name, IP address and hostname in the VLAN color, and operating system with version in the body. The card border takes the device's VLAN color, or a neutral border for devices on a trunk.
- Firewall and server hardware tiles Hardware such as CPU, memory, GPU, network cards and every disk is shown as a tile with type, part name and a sub line, for example passthrough to a specific guest. The firewall card also lists its services, such as DNS, DHCP, VPN and intrusion prevention.
- Hypervisor guests and DMZ containers The server card shows the hypervisor with its hardware, the virtual machines and containers outside the DMZ, and every DMZ container with container ID, IP and hostname. Containers running several apps appear as one taller card with a row per app, and public apps behind a reverse proxy are shown with their public hostname.
- Storage pools Storage pools are drawn with their disks, vdev layout and usage. ZFS sizes are shown in TiB or GiB as ZFS reports them, and disk sizes in TB as sold.
- Internet exposure, legend and networks table An "Open to the internet" card lists port forwards with port, protocol, target and purpose; internal-only ports are deliberately left out. A legend explains line styles and widths, and a networks table lists every VLAN with ID, name, subnet and a one-line policy.
- Optional flow explainer The example includes a media pipeline panel that shows how a request moves between media management apps, a downloader and the media server through two shares. CLAUDE.md suggests removing the section or reusing it for another flow.
- Redacted and unredacted output By default the real domain is replaced with
redacted.comand wireless network names get generic labels, so the PNG can be posted publicly.python3 build.py --unredactedrenders a private version with the real values. Output goes toout/homelab.svgandout/homelab.png. - Icon download script
fetch_icons.pydownloads service logos from dashboard-icons through jsDelivr and falls back to raw GitHub when jsDelivr refuses a file. New icons are added by mapping a local name to a dashboard-icons name, or by dropping an SVG intoicons/and referencing its file name in the inventory. - Measured text widths and overflow checks Label widths are measured with Pillow from the real font file, so tabs and badges fit their text; without Pillow a rough estimate is used.
assertstatements at the end of layout sections fail when a column or panel overflows, which points to the place where the canvas height must grow. - Agent instructions in CLAUDE.md The file gives a coding agent a table of the hardcoded layout sections and typical changes, an interview of eleven topic groups (privacy, internet edge, firewall, switches, VLANs, devices, servers, guests, storage, port forwards, extras) and a list of read-only commands for Proxmox, Docker, ZFS and TrueNAS to run only after asking.
- Documented design rules Solid lines are physical cables only, dotted lines are logical links over the internet, and dashed grey lines are KVM console connections. Container chips show the container ID top right and the last IP octet below it, with a LAN pill for public hostnames reachable only from LAN or VPN.
- Installation on Linux The README gives package commands for Arch and CachyOS (
pacman -S python-yaml python-pillow librsvg ttf-fira-sans ttf-fira-code) and for Debian and Ubuntu (python3-yaml,python3-pil,librsvg2-bin,fonts-firacodeplus Fira Sans). The fonts must be installed and found through fontconfig, otherwise every width calculation is off.
Where homelab-diagram fits
Posting a homelab diagram publicly
The original purpose of the project is a diagram for a public r/homelab post. The default render replaces the real domain and wireless network names, and CLAUDE.md lists a final step of searching out/homelab.svg for the real domain, network names and other private values before the image is shared. The unredacted render is meant for private use.
Adapting the diagram to another lab with a coding agent
The README describes cloning the repository, opening it in Claude Code and asking for help making the diagram for one's own homelab. Following CLAUDE.md, the agent interviews the user in rounds of three to six questions or reads existing documentation, rewrites inventory.yaml, adapts the hardcoded positions in build.py and iterates on the render. Other agents can use the same file as context.
Adapting the diagram by hand
Without an agent, the README's three steps apply: change inventory.yaml to describe the network, look at the render, and move the layout coordinates in build.py for the parts that do not fit, such as the edge chain, the device row under the switch and the column split in the server card. New service icons are added to icons/ and referenced by file name.
Documenting VLANs, switch ports and link speeds
The diagram combines physical and logical network information in one image: which device sits on which switch port, the negotiated speed of each cable, which VLANs are tagged or untagged on each port, the subnet and policy of each VLAN and which ports are forwarded from the internet. CLAUDE.md names switch commands, for example on RouterOS, that print port speeds and VLAN membership as input.
Documenting a Proxmox and TrueNAS server
The server section of the example shows a Proxmox host with its hardware tiles, a virtualized TrueNAS SCALE with passthrough disks and two pools, and one unprivileged LXC container per service in the DMZ, grouped into columns such as edge and security, monitoring, media, productivity and chat. The read-only commands listed in CLAUDE.md (pct list, qm list, zpool list -v and others) collect this data. The project license is MIT.
Reviews of homelab-diagram
Be the first to share your experience with homelab-diagram.
Write a review
Loading review form…
Alternatives to homelab-diagram
 MermaidOpen-source JavaScript diagramming library: write flowcharts, sequence, ER, Gantt and many other diagrams as Markdown-like text and render them to SVG in the browser, in docs and in build pipelines.
 ProxmoxProxmox VE is an open-source server virtualization platform that combines KVM virtual machines, LXC containers, storage and networking in one web interface.