

What is Quant-UX?
Quant-UX is an open-source tool for building interactive prototypes, testing them with real users and reading the resulting behavior data in the same workspace. It was started and is maintained by Klaus Schaefers, who is listed as founder on the Quant-UX team page alongside an AI developer and two designers. The project describes its scope as prototype, test and learn: designers draw screens, testers open a share link, and the application records each session for later analysis.
Two deployment paths exist. The hosted service at quant-ux.com is free, with the pricing page listing unlimited prototypes, unlimited user tests, real-time collaboration, analytics and questionnaires. For self-hosting, the README documents a Docker Compose stack with four containers: MongoDB, the Vue front end (klausenschaefersinho/quant-ux), the Java backend (klausenschaefersinho/quant-ux-backend) and a WebSocket server for collaboration. Elestio and RepoCloud offer one-click deployments, a community Kubernetes configuration exists, and manual installation from source is also documented.
The project does not publish GitHub releases or tags. Versioning happens in the code: the package.json on the master branch declares version 5.0.25, while the public website footer showed 5.0.24 when checked. Recent commits through October and November 2026 added flex layout features, new icons, AI agent changes and fixes to the keep-aspect-ratio control; a September commit restored OpenRouter as an AI provider. Treat the Docker latest image as a moving target and pin a digest if you need repeatable deployments.
The front end in this repository is written in Vue 2 with D3 for charts and an Express server that proxies API calls to the backend. The backend lives in the separate qux-java repository, built on Vert.x 3.9 with MongoDB storage and SMTP for account mail. Prototypes use a flat JSON format with screens, widgets, lines and groups linked by ids, documented in the file format reference.
The front end is licensed under GPL-3.0 and the qux-java backend under MIT. Quant-UX is not a general vector illustration tool, not a design handoff platform and not a production web analytics product: its analytics apply to sessions run against a Quant-UX prototype. The official documentation covers the canvas, logic, scripts, testing and analytics features.
Quant-UX screenshots
Explore the interface. Open a screenshot to view it at full size.
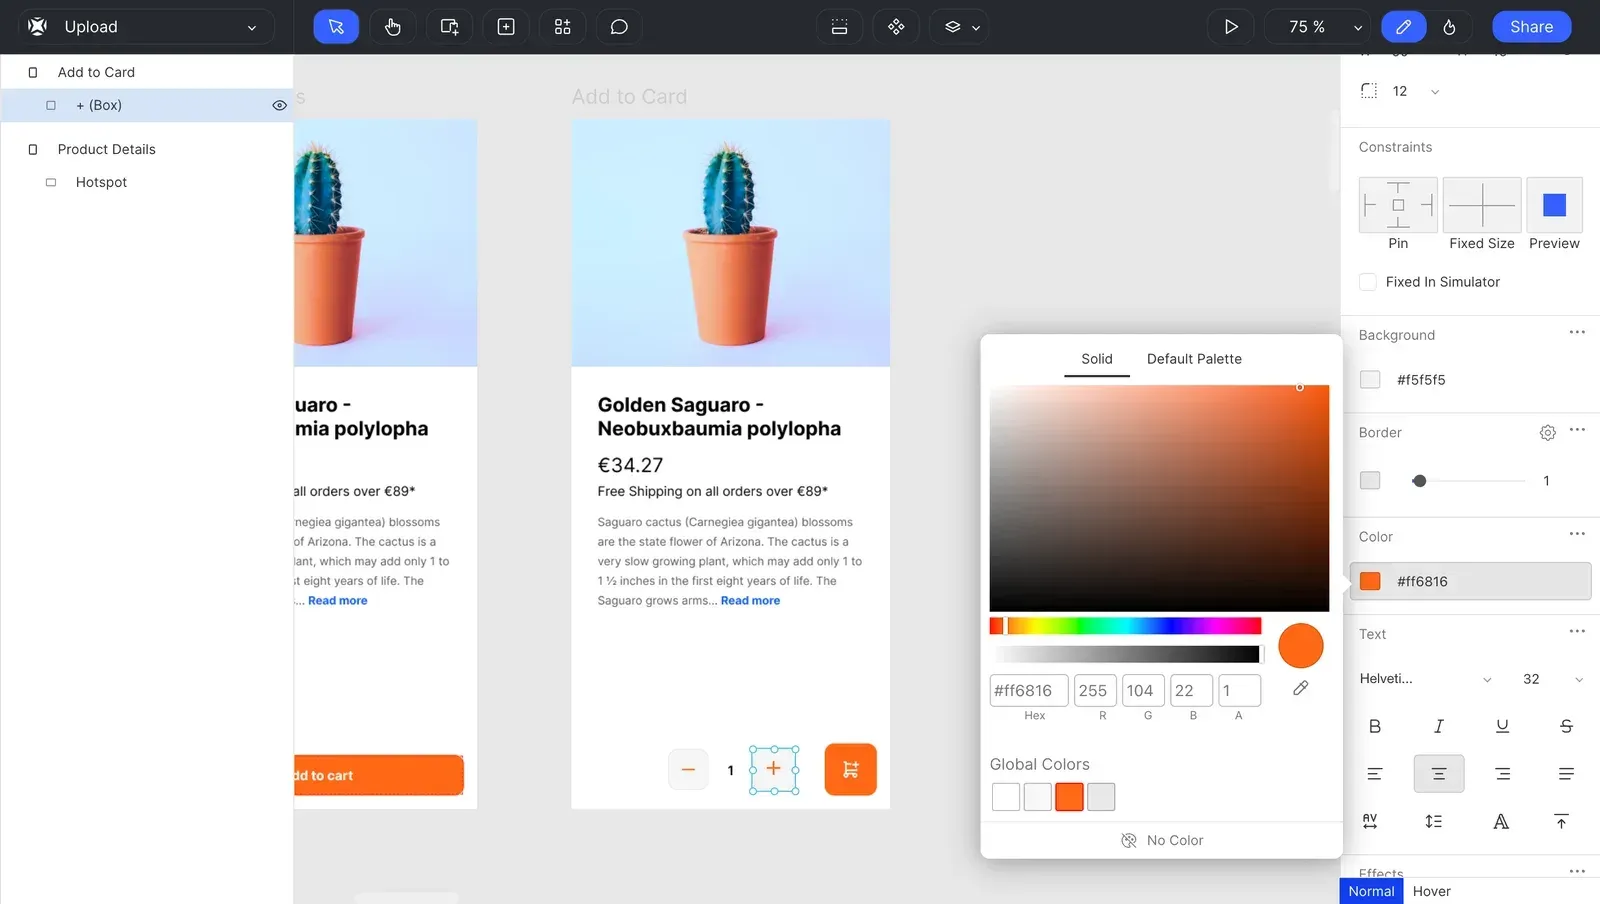
Official Quant-UX screenshot of the visual designer editing an add-to-cart screen with the color picker open.
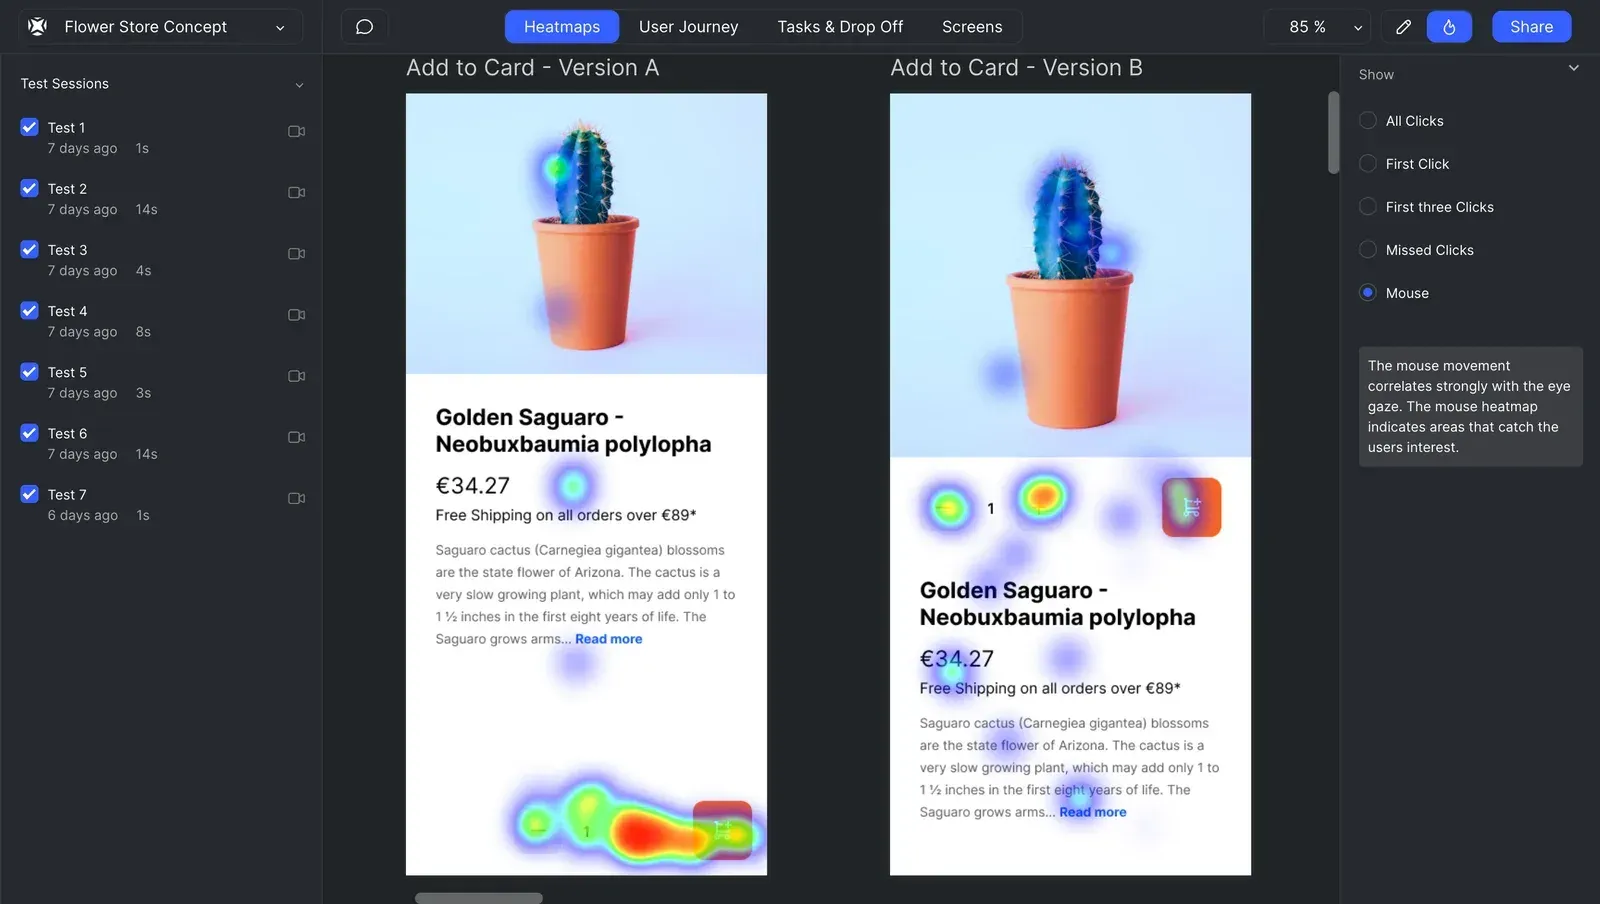
Mouse movement heatmap comparing version A and version B of an add-to-cart screen, with seven recorded test sessions.
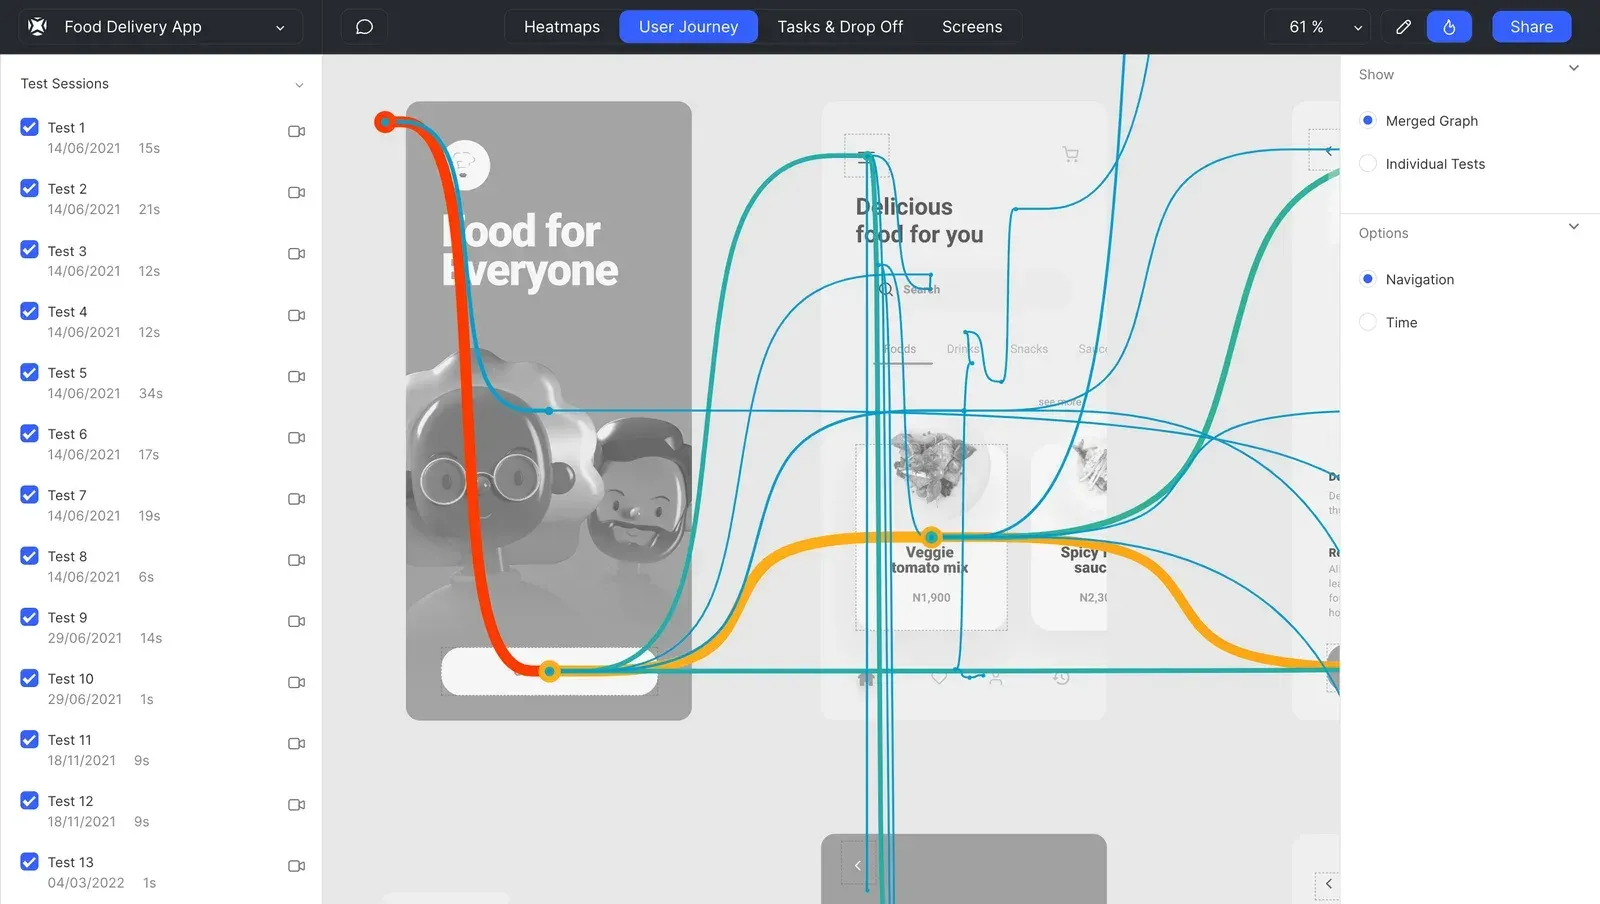
Merged user journey graph for a food delivery prototype; thicker lines mark common paths across sessions.
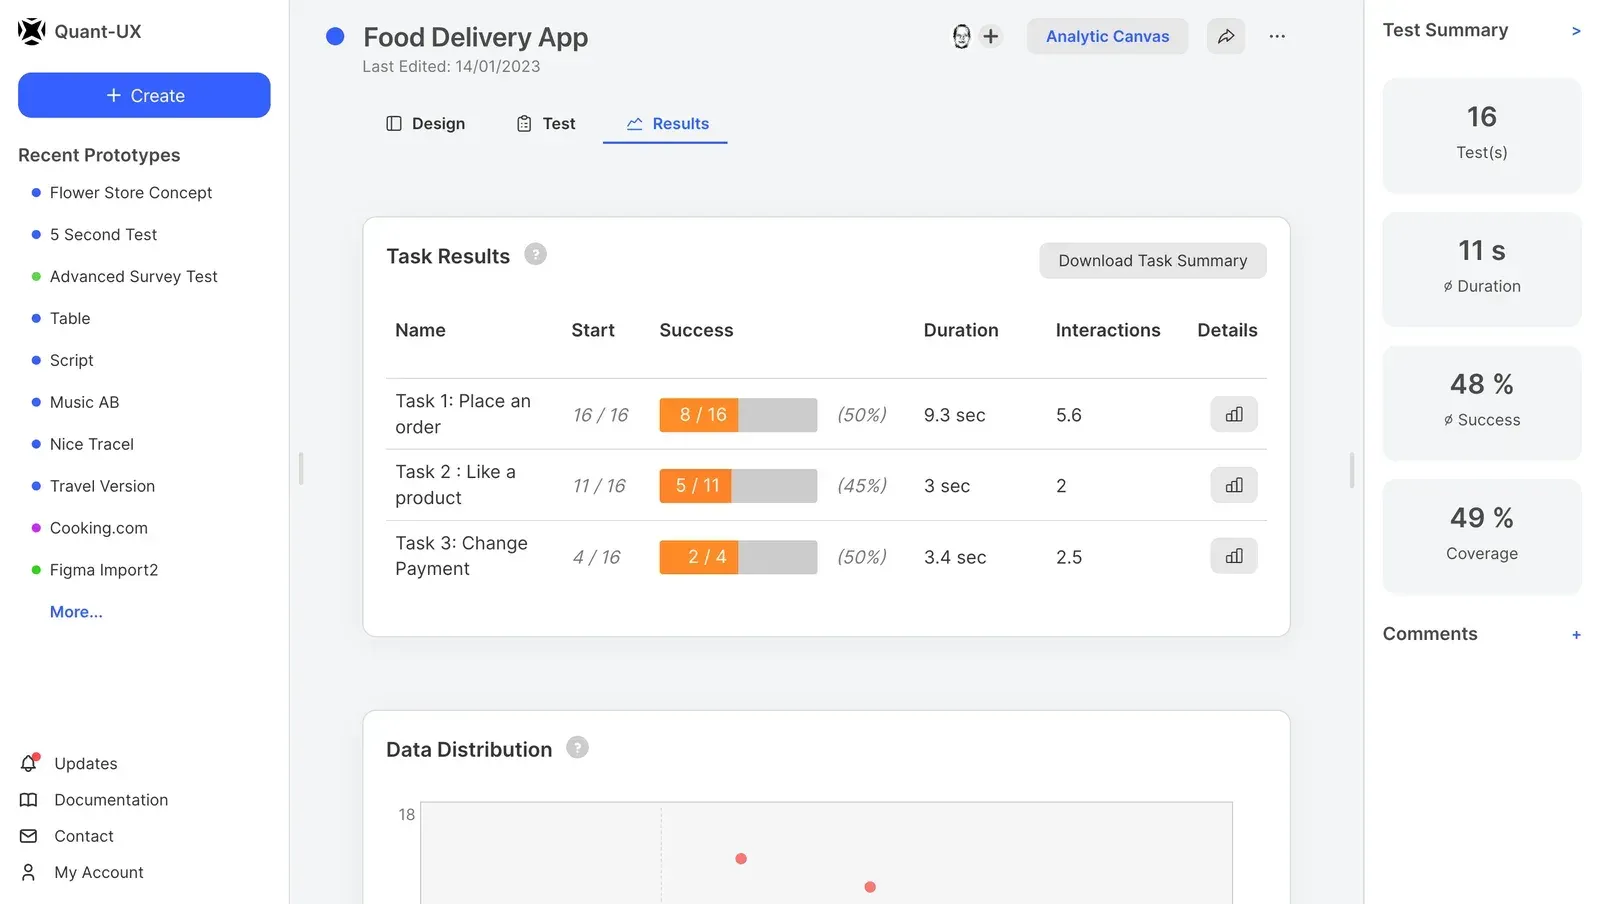
Task results for a food delivery prototype with start and success rates, mean duration, interactions and a test summary.
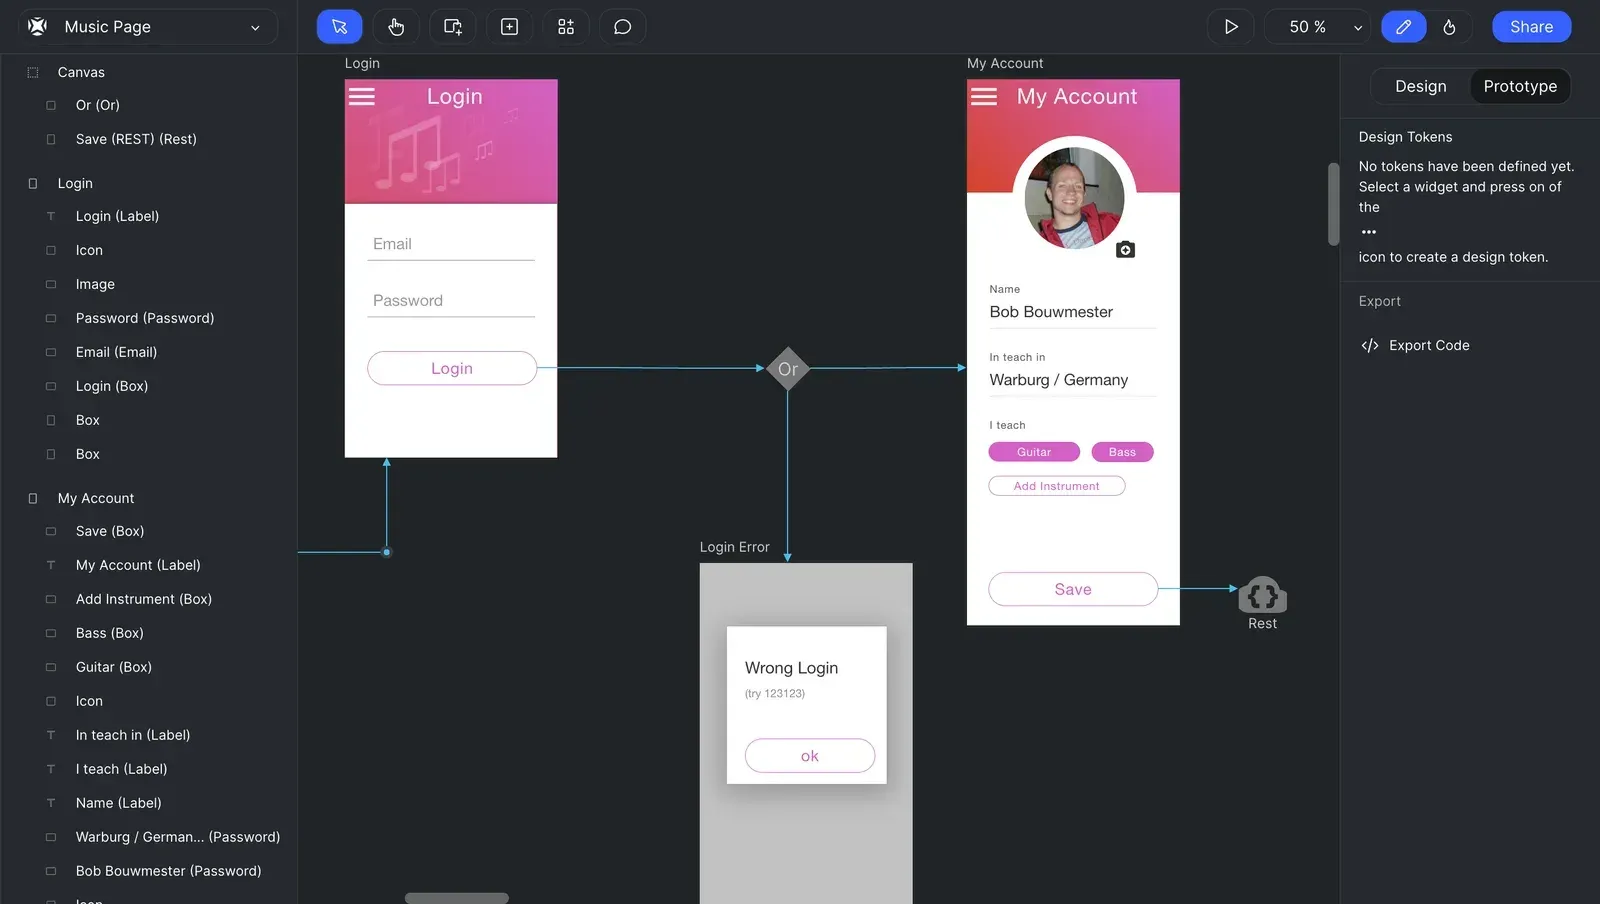
Prototype view of a login flow: an Or operator routes to My Account or Login Error, and Save calls a REST web service element.
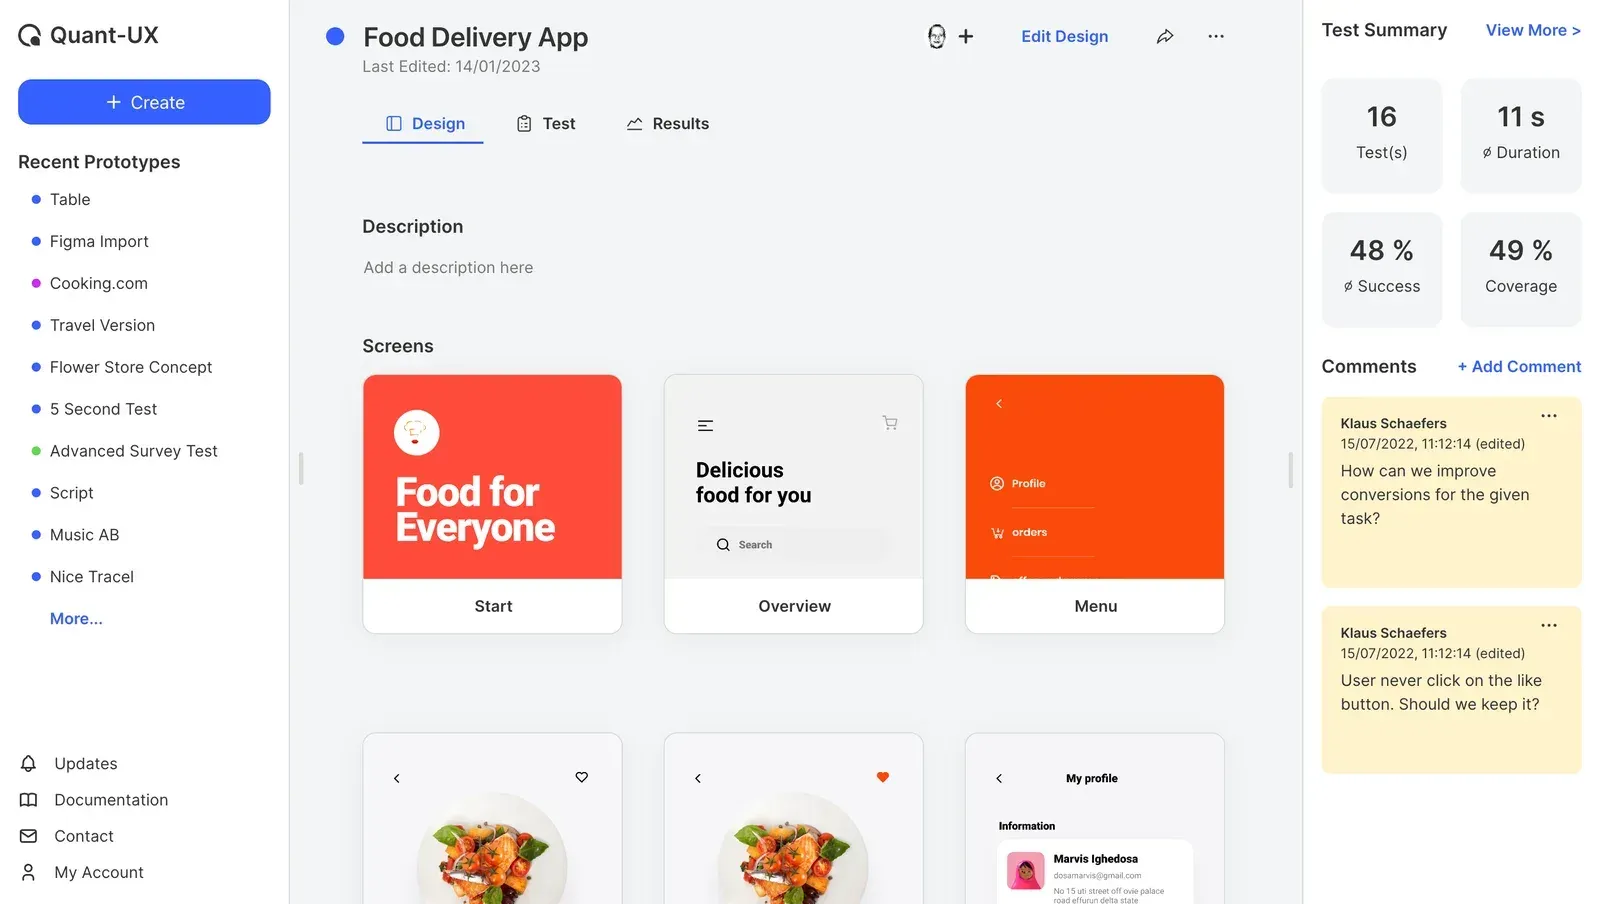
Prototype overview with Design, Test and Results tabs, screen thumbnails, test summary and comments.
Source: official Quant-UX project page.
Key capabilities
- Visual design canvas Screens are placed on an infinite canvas and filled with widgets, with keyboard shortcuts such as S for screen, W for widget, R for rectangle, T for text and H for hotspot. The canvas has three views: Design for appearance, Prototype for links and interaction, and Low Code for properties relevant to turning a prototype into an application. Overlay screens model modal dialogs on top of other screens.
- Functional widgets Unlike click-through mockups, Quant-UX widgets behave like real controls: testers can type into text fields, toggle checkboxes and open dropdowns. Widget palettes cover wireframe, survey, iOS and Android styles. Repeater grids, smart cloning and grid resizing reduce manual layout work.
- Design systems Design tokens hold global styles such as colors, borders and shadows, and every widget linked to a token updates when it changes. Components and master screens let a team reuse elements across screens. Custom fonts and screen segments are covered in separate documentation pages.
- Links, animations and logic flows Screen transitions are created by linking a widget or screen to a target and choosing the trigger event and animation. Timed transitions build splash screens and 5-second tests. Logic operators route users conditionally, and the Animation Composer adds motion to transitions.
- Data binding and form validation Prototypes keep a hidden JSON data object during a test. Inputs bind to paths such as
emailoraddress.street, so values entered on one screen can appear on later screens. Fields can be marked as required and given valid input formats. - Web service element A Web Service element calls a configurable URL with a chosen HTTP method and payload. It can run on a button click, when the simulator loads or on a repeating interval, and can pass its result to a screen, script or logic element. Prototypes that call external services send tester data to those services, which the privacy policy places outside Quant-UX control.
- JavaScript scripts (beta) Script components run small JavaScript snippets with access to the
databinding object and aquxobject for styles and visibility. Scripts can run on click, on data change or on load, and can return a screen name for programmatic navigation. They are a beta feature that must be enabled in the settings menu, as described in the script documentation. - Image and Figma import PNG and JPEG files dropped on the canvas become screens, or images inside an existing screen. Figma projects are imported through a wizard that needs a Figma personal access token and the project URL. Imported designs can then receive Quant-UX links and widgets for testing.
- AI design assistant An optional assistant generates prototype fragments such as a login form, which the designer then adjusts. The privacy policy lists OpenAI, Anthropic, Google and OpenRouter as possible providers. With a user-supplied API key, prompts and design data go from the browser to the selected provider; self-hosters can instead set a shared OpenAI token in
QUX_AI_TOKEN, which the README warns can create significant costs. - Shareable usability tests The Share dialog creates a test link that opens the prototype on a landing page with a configurable welcome message and splash image. A QR code launches the prototype on a phone without an app. An option records only the first session per user to avoid repeated runs skewing data.
- User tasks and task KPIs Tasks have a name, description and a recorded sequence of steps, by default screen loads only. For each task Quant-UX reports start rate, success rate, mean duration and mean interactions, with scatter and box plots to find outliers. The analytic tasks guide defines how each rate is counted.
- Screen recordings Every test session is recorded inside the browser without extra software. Recordings open from the session list, the user journey graph and individual points in the scatter plots. This links an outlier in the numbers directly to the session that produced it.
- Think-aloud testing When enabled, testers can turn on their microphone at the start of a session, and their speech is transcribed and stored with the interaction data. Microphone use is optional for testers; a session continues to record normally if they decline. Transcripts are searchable for later review.
- Heatmaps and analytic canvas The analytic canvas shows all clicks, first clicks, first three clicks, missed clicks on non-actionable areas and mouse movement heatmaps. Scroll visibility, scroll time, screen views and dwell time are available per screen. Selecting a widget shows its click count, first clicks, time before click and test coverage.
- User journey and drop-offs The journey graph merges all sessions and highlights common paths, or shows individual flows. The drop-off view shows where users leave a task and how long each step takes. Both are documented in the analytic canvas guide.
- A/B testing An A/B operator in the logic flow sends each tester randomly along one of the wired variants. Results compare duration, success rate and interactions between variants. The documentation recommends more than 60 participants per variant for meaningful differences.
- Surveys and questionnaires Star ratings, NPS elements and normal inputs become survey items when the Survey Element option is set in the Prototype view. Answers appear in the dashboard and can be shown alongside task success per tester. Questionnaires support conditional flows and randomization and can be used inside a prototype or on their own.
- Self-hosting with Docker The documented Compose file runs MongoDB, the front end on port 8082, the backend on port 8080 and the WebSocket server on port 8086. Required settings include
QUX_JWT_PASSWORD, SMTP credentials andQUX_HTTP_HOSTfor links in mails. Sign-up can be disabled or limited to listed email domains, and Keycloak can replace the built-in authentication.
Where Quant-UX fits
Running an unmoderated usability test
Build or import the screens, wire the main flow and define one to three tasks with recorded steps in the Test tab. Write a welcome message that states the purpose and what testers should do, then share the link or QR code. Enable the single-session option if testers might reopen the link. The testing guide suggests at least 5 users for qualitative findings and around 30 for statistically meaningful numbers. Afterwards, check start and success rates before looking at heatmaps.
Comparing two design variants
Keep the screens identical except for the element under test, such as a button position or label. Place an A/B logic operator after the triggering widget and wire both variants. Compare duration, success rate and interactions in the results, and open recordings of outliers before drawing conclusions. With fewer than about 60 testers per variant, treat differences as directional rather than proven.
Testing forms and data entry
Use functional input widgets with data binding and validation rules so testers type real values. Bind fields to readable variable names and display entered data on a confirmation screen to check the flow. Avoid collecting real personal data unless the study needs it: anything typed into an input becomes part of the stored interaction data, and the study owner remains responsible for it as data controller.
Validating a Figma design with users
Create a Figma personal access token, then use the Import wizard with the project URL. Add hotspots, links and functional widgets where testers need to interact. Check that imported frames have the expected screen size and that fonts render correctly; the docs note that some Chrome versions enforce a minimum font size that distorts zoomed prototypes.
Combining behavior data with spoken feedback
Enable think-aloud testing so willing testers can narrate while they work, and add a short survey at the end with star ratings or NPS items. Compare survey answers with task success per tester in the dashboard. A tester who rates the app highly but failed a task is a reason to watch that recording and read the transcript.
Hosting research data internally
Deploy the Docker Compose stack behind a reverse proxy with TLS, set a long QUX_JWT_PASSWORD, configure SMTP and restrict sign-up with QUX_USER_ALLOW_SIGNUP or allowed domains. Map the image folders and MongoDB data to persistent volumes and include them in backups. Leave QUX_AI_TOKEN empty unless the organization has approved sending design data to an AI provider.
Reviews of Quant-UX
Be the first to share your experience with Quant-UX.
Write a review
Loading review form…
Alternatives to Quant-UX
 OpenPencilOpenPencil is an open-source design editor for macOS, Windows, Linux and the browser. It reads and writes Figma .fig files, edits designs through a bring-your-own-key AI chat, and exposes documents to scripts, a CLI, MCP clients and a Vue SDK.
 OpenPanelOpenPanel combines web traffic metrics with product analytics: funnels, retention, profiles, session replay, revenue and AI call tracking. It is AGPL-3.0, cookieless by default and runs in an EU cloud or on your own Docker server.