

What is OpenSnitch?
OpenSnitch is an interactive application firewall for GNU/Linux, inspired by Little Snitch according to its repository. When a program tries to open a new network connection, OpenSnitch can show a pop-up with the executable, the destination and the user, and the answer becomes a rule that allows or denies that traffic once, for a limited time, until restart or permanently. It can also block lists of domains and IPs system-wide, edit nftables system rules, manage several machines from one GUI and forward events to a SIEM. The project has been on GitHub since April 2017 under the evilsocket account. The README points donations to the GitHub Sponsors page of maintainer gustavo-iniguez-goya, and the project wiki is the official documentation.
OpenSnitch has two parts. The daemon, opensnitchd, is written in Go and runs as a systemd service. It adds interception rules to netfilter (nftables by default, iptables as an alternative), receives each new connection, finds the process that opened it and matches it against the rules in /etc/opensnitchd/rules. Process identification uses eBPF by default since version 1.4.0, with ProcFS and the Linux audit subsystem as alternative monitor methods. The GUI, opensnitch-ui, is a Python and Qt application that talks to the daemon over gRPC, by default through the Unix socket /tmp/osui.sock. The FAQ explains that gRPC was chosen over D-Bus so the GUI can also listen on TCP and receive events from daemons on other computers.
Packages are published on the GitHub releases page: daemon packages in .deb and .rpm format for x86_64, i386, arm64 and armhf, plus an architecture-independent GUI package, with PGP signatures. The installation guide notes that OpenSnitch is also available in Debian 12 Bookworm and Ubuntu 23.04 from versions after 1.5.2, in the Arch Linux repositories and as a NixOS service option. The project is licensed under the GNU General Public License version 3; the AppStream metadata in the repository declares GPL-3.0-or-later.
The current release is OpenSnitch v1.8.0, published on December 15, 2025. Its GUI is ported from PyQt5 to PyQt6, so the packaged GUI no longer works by default on Ubuntu 22.04 or earlier, Linux Mint 21.2 or earlier and openSUSE 15.5 or earlier, while the 1.8.0 daemon still works with the 1.7.2 GUI. All daemon netfilter rules now live in one nftables table named opensnitch. It also adds daemon tasks such as an IOC scanner, server worker and client limits in the GUI and a version checker plugin. A listed known issue: on some 6.17.x kernels, system firewall rules with verdicts such as reject or log fail to load. v1.7.0 (May 2025) had added the process tree, checksum, parent path and user name filters and a Netstat view.
OpenSnitch is Linux software only. eBPF process monitoring requires kernel support for kprobes, debugfs or tracefs, perf events, ftrace and the bpf syscall, and kernels built without them, such as xanmod, fall back to ProcFS. Editing system firewall rules from the GUI works with nftables only. Domain block lists may not work when the system resolves names through systemd-resolved, and the interception notes describe cases where the process behind a connection cannot be identified, mostly with ProcFS or audit.
OpenSnitch screenshots
Explore the interface. Open a screenshot to view it at full size.
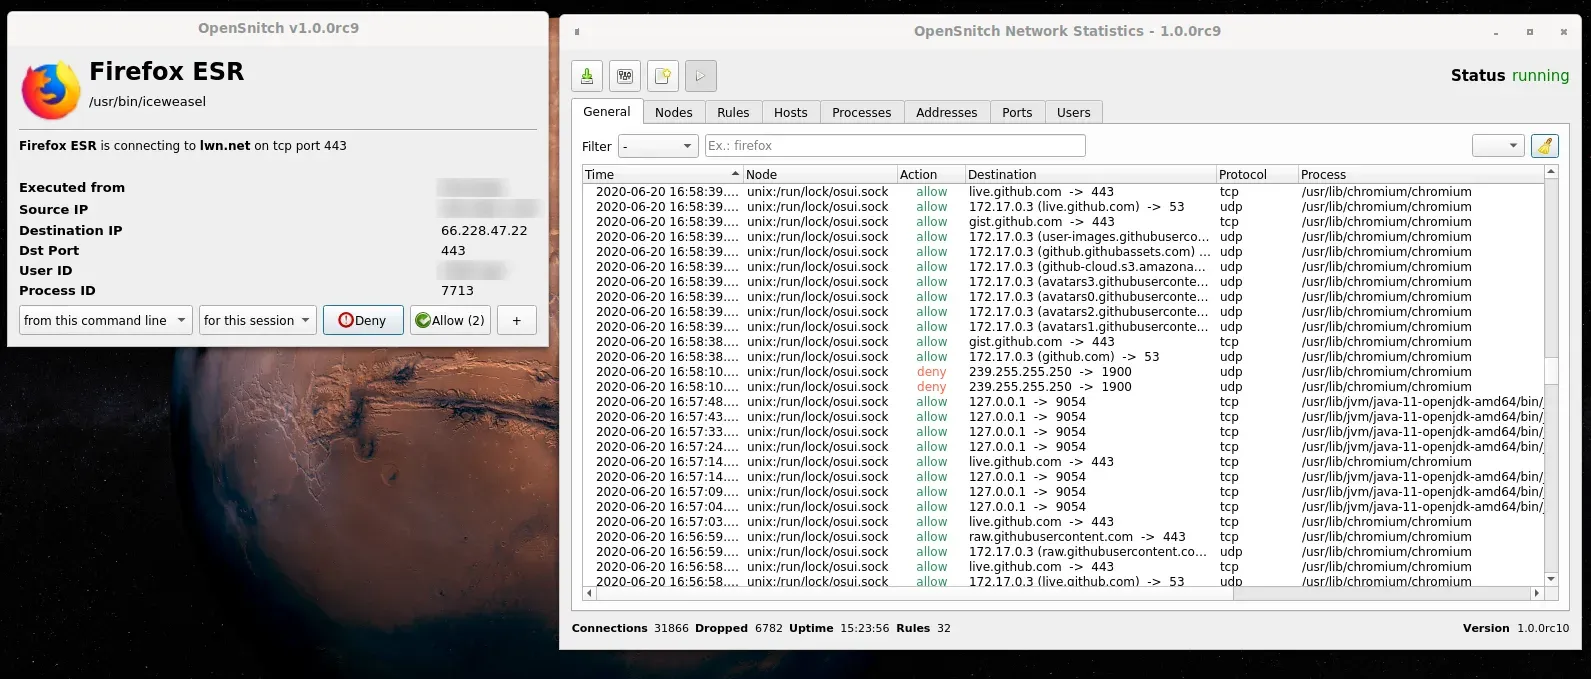
README screenshot from version 1.0.0rc9: the prompt offers Deny or Allow for this command line and session, beside the General tab of the statistics window. Username and local IP address blurred.
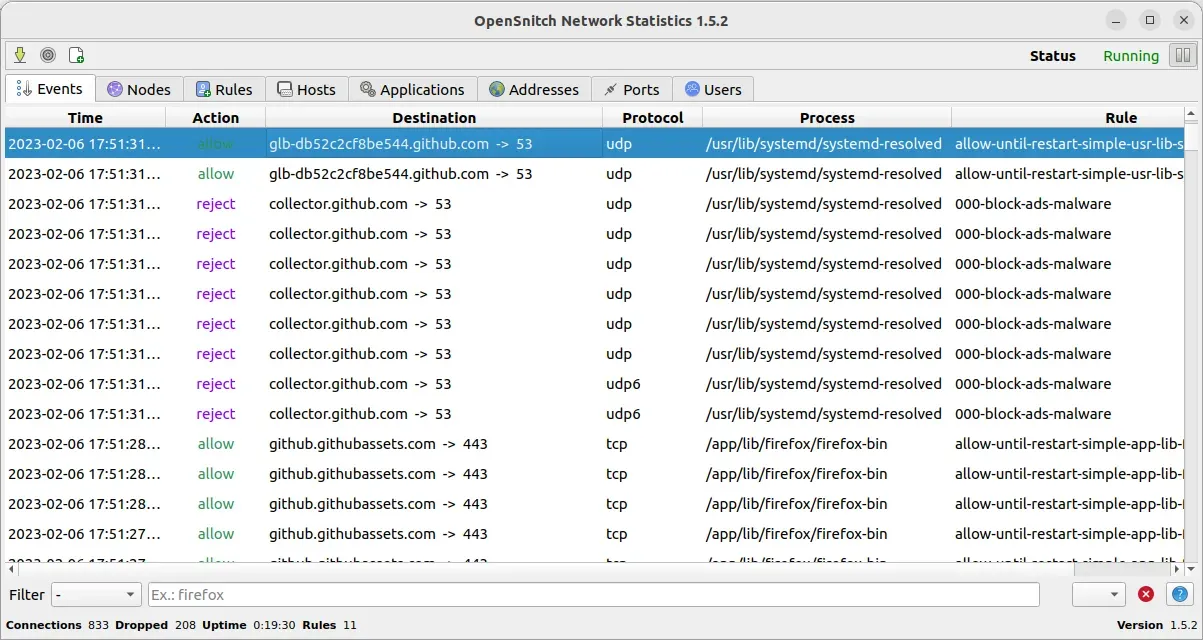
Events tab in version 1.5.2: rejected lookups match the 000-block-ads-malware rule, other connections match temporary allow rules.
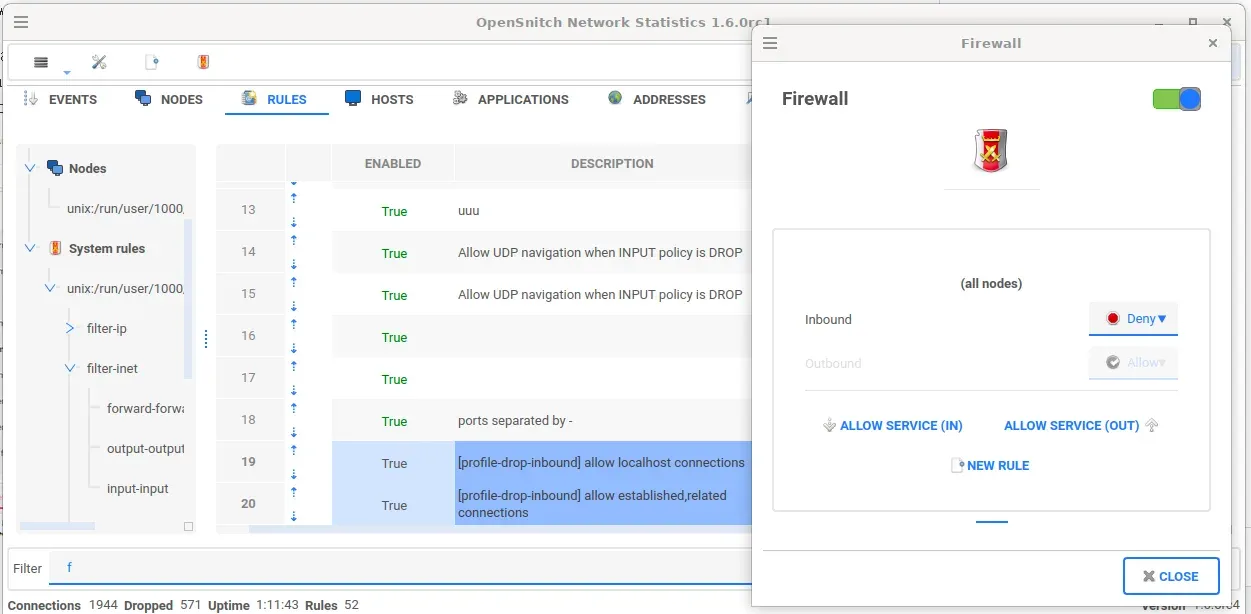
System firewall view from a 1.6.0 release candidate: inbound policy Deny, buttons to allow inbound or outbound services, and the generated localhost and established-connection rules.
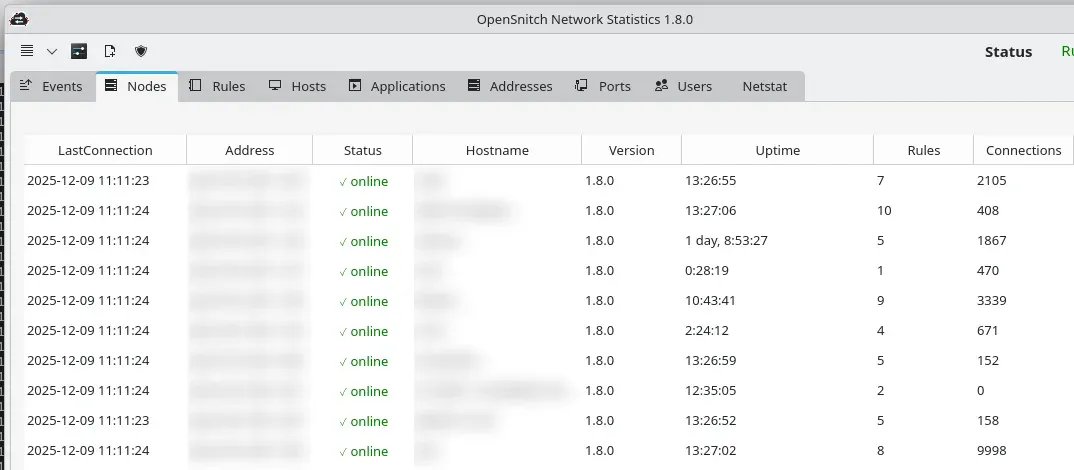
Nodes tab in version 1.8.0 from the wiki: several daemons report to one GUI. Node addresses and hostnames blurred.
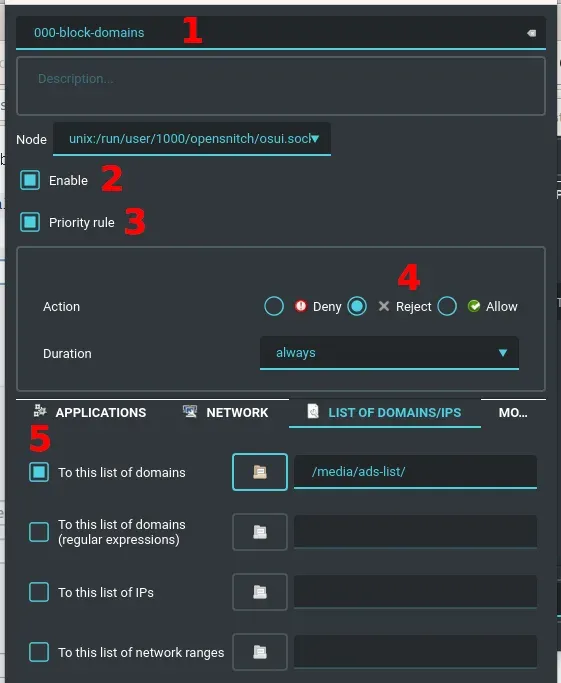
Rule editor from the block-lists guide: a priority Reject rule pointing to a directory of domain lists.
Source: official OpenSnitch project page.
Key capabilities
- Interactive connection prompts When a process opens a new connection and no rule matches, the GUI shows a pop-up with the executable name, the typed command, the path, the destination host or IP and port, the user ID and the process ID. The answer can apply to the executable, the command line, the destination or other fields, and the duration ranges from once, through 30 seconds up to 12 hours, until restart or always. If nobody answers, the default action is applied after a configurable timeout (30 seconds by default).
- JSON rule files Rules are JSON files in
/etc/opensnitchd/rules, and the daemon reloads them when they change, without a restart. Each rule has an action (allow, deny, which drops the packet, or reject, which kills the socket), a duration and an operator. Operator types are simple comparison, regular expression (Go RE2 syntax), network range, lists and a combined list type. The rules reference documents every field. - Matching by process, user and destination Rules can match the executable path, the full command line, any ancestor in the process tree (
process.parent.path, since 1.7.0), environment variables of the process, MD5 or SHA1 checksums of the binary, the user ID or user name, the protocol, source and destination IPs and ports, the destination host, network ranges and input or output interfaces. Checksum matching is enabled withRules.EnableChecksums. - Rule order and priority Rules are evaluated in alphabetical order of name. The first matching deny or reject rule, or the first matching rule marked as Priority, wins; otherwise the last matching allow rule applies, and with no match the pop-up or the default action follows. The documentation uses name prefixes such as
000-to control the order, and notes that simple rules are faster to evaluate than regexp and list rules. - Rules editor in the GUI Rules can be created and edited in a dialog with tabs for applications, network and lists of domains or IPs. Each field accepts a literal value or a regular expression, so one rule can cover several ports or every Python interpreter under
/usr/bin. Comparisons of host, path and arguments are case-insensitive by default since 1.2.0. - Block lists for domains, IPs, networks and checksums A rule can point to a directory of list files: domains in hosts format, domain regular expressions, single IPs, network ranges (for example for country blocking) and, since 1.7.0, MD5 checksums of executables. The directory is reloaded when files change, but lists are not refreshed from the internet automatically. The block-lists guide warns that regular expression lists should stay small (around 500 entries) for performance.
- Process monitor methods The daemon finds the process behind a connection with eBPF (the default since 1.4.0), ProcFS or the audit subsystem through auditd and its af_unix plugin. The method is chosen in the Preferences dialog or with
ProcMonitorMethod. According to the eBPF page, the eBPF method also sees connections initiated from kernel space, such as WireGuard tunnels.opensnitchd -check-requirementsreports whether the kernel has the needed features. - Protocols and connection states OpenSnitch intercepts new connections (netfilter state NEW) of TCP, UDP, UDP-Lite, SCTP and ICMP, to and from any port, over IPv4 and IPv6; support for IPv6 tunnels was added in 1.7.0. Connections that cannot be tied to a process are handled by the
InterceptUnknownoption, which can show a pop-up for them, for example for VPN, NFS or forwarded container traffic. - System firewall rules (nftables) Since 1.6.0 the GUI can list and edit regular netfilter rules and chain policies stored in
/etc/opensnitchd/system-fw.json. Setting the inbound policy to deny adds rules that keep established and localhost traffic working, and dedicated buttons allow an inbound or outbound service such as SSH or WireGuard. Targets include accept, reject, jump, redirect, dnat and snat. With iptables the file can still be edited, but not from the GUI; see System rules. - Coexistence with other firewalls OpenSnitch does not disable firewalld, ufw or other firewall tools and deletes only its own rules. It checks periodically that its interception rules are present and re-adds them if they are missing;
FwOptions.MonitorIntervaldefaults to 15 seconds. Since 1.8.0 its rules are grouped in one nftables table namedopensnitch. - Statistics window The main window has tabs for Events, Nodes, Rules, Hosts, Applications, Addresses, Ports, Users and Netstat. Views can be filtered, sorted and opened in detail by double-clicking a row. The Netstat tab lists the current connections of a node in a way similar to
ss. - Process details dialog From the Applications view a dialog shows details of a running process: its command line, working directory and memory figures, with tabs for status, open files, I/O statistics, memory mapped files, stack and environment variables. Since 1.7.0 the daemon also obtains and displays the process tree of a connection.
- Central GUI for several nodes The GUI acts as a gRPC server and each daemon is a node. Started with
opensnitch-ui --socket "[::]:50051"or reconfigured in Preferences, it accepts daemons from other machines, shows them in the Nodes tab and can apply rules and system firewall rules to one node or all of them. The default of 20 server workers covers about 10 to 15 nodes; see Nodes. - TLS between nodes and GUI Since 1.6.1 node connections can be encrypted. The authentication page describes three modes: simple (no encryption), tls-simple (a server certificate plus a shared CA or server certificate for all nodes) and tls-mutual (a client key and certificate per node). OpenSSL commands for the certificates are included.
- SIEM integration through syslog Since 1.6.0 the daemon can send intercepted events to a syslog logger, local or remote over TCP or UDP, in RFC 3164, RFC 5424, CSV or JSON format, with configurable timeouts, workers and tag. The SIEM guide includes setups for Grafana with Loki, Promtail and syslog-ng, and for Elasticsearch, Logstash and Kibana.
- Daemon configuration file
/etc/opensnitchd/default-config.jsonholds the GUI address, log file and level, default action (allow, deny or reject), monitor method, firewall backend, rules path, checksum option, eBPF worker settings and statistics limits, and changes are applied without a restart. GUI settings are stored in$HOME/.config/opensnitch/settings.conf. - Daemon tasks and GUI plugins The daemon can run scheduled tasks; 1.8.0 adds an IOC scanner that runs YARA, scripts, debsums or dpkg checks on a schedule and sends results to the GUI, and a downloader task. The release notes mark tasks as work in progress. GUI plugins include highlighting of rows, a downloader for block lists, a VirusTotal lookup of IPs, domains and checksums when a pop-up appears, and a version checker.
- Linux packages and installation Downloaded packages install with
sudo apt install ./opensnitch*.deb ./python3-opensnitch-ui*.debordnf install. If the daemon does not start automatically,sudo systemctl enable --now opensnitchenables it. On the Debian repositories,apt install --no-install-recommends opensnitchinstalls only the daemon, for example on a server managed from another machine's GUI.
Where OpenSnitch fits
Learning what a Linux desktop connects to
The getting started guide describes a passive first phase: setting the pop-up default action to Allow, optionally disabling pop-ups, and letting OpenSnitch record connections for hours or days. During that time it creates temporary rules, which appear in the Rules tab, while the Events, Applications and Hosts views show which programs contacted which hosts. The guide then describes converting the wanted temporary rules into permanent ones (duration always) and switching the default action back to deny, so that new, unknown connections trigger a prompt.
Limiting an application to a few domains
The block-lists guide shows a pattern with two rules: 000-allow-app allows the application's executable to reach only the domains in a list directory, and 001-deny-all-from-app denies everything else from the same executable. Because rules are evaluated alphabetically and a matching deny stops evaluation, the names decide the outcome. The best-practice notes apply the same idea to python3, curl or wget, filtered by command line, user, IP and port.
Blocking ad, tracker and malware domains system-wide
A rule named 000-block-domains, enabled with Priority, the Reject action, duration always and a list of domains in hosts format, blocks those domains for every application on the machine. The guide uses the test domain block-test.developerdan.com to check that matches appear under the rule name. With debug logging enabled, /var/log/opensnitchd.log shows which list entry matched. Similar listings on iThub include Pi-hole, a DNS sinkhole for a whole network, and Zen, a local proxy-based ad blocker.
Restricting outbound traffic on a server
The rules page describes two approaches for servers: a default action of deny or reject with explicit allow rules for system binaries and services, or a default of allow combined with deny rules. Its examples include an 000-deny-tmp rule that rejects connections from executables under /tmp, /var/tmp, /dev/shm and /memfd, a rule that allows curl only to one proxy IP and port, and block lists of mining pools. Incoming connections keep working when only new outbound connections are denied.
Managing several machines from one GUI
Daemons on several machines, including Raspberry Pi boards served by the armhf and arm64 packages, can report to one GUI listening on TCP. The Nodes page describes changing each node's server address first and then the GUI address, and the Nodes tab lists every node with its version, uptime, rule count and connections. The Rules tab shows the rules of all nodes, with batch actions, and the system firewall dialog can target one node or all nodes. TLS modes from the authentication page encrypt and authenticate this traffic.
Forwarding connection events to a SIEM
Adding a syslog logger under Server.Loggers in the daemon configuration sends every intercepted event to a local or remote syslog receiver. The SIEM guide provides downloadable Docker Compose setups for Grafana, Loki, Promtail and syslog-ng, including a Grafana dashboard where the events appear under an opensnitch label, and for Elasticsearch, Logstash and Kibana.
Reviews of OpenSnitch
Be the first to share your experience with OpenSnitch.
Write a review
Loading review form…
Related to OpenSnitch
 Pi-holePi-hole is a free, EUPL-1.2 licensed DNS sinkhole for Linux and Docker. It blocks advertising and tracking domains for the whole network, with blocklists, groups, a built-in web dashboard, a REST API, an optional DHCP server and privacy levels.
 ZenZen is an MIT-licensed, system-wide ad blocker for Windows, macOS and Linux from Irbis. A local proxy filters browser and app traffic with EasyList-style and hosts lists, custom rules and a request history.