

What is Chartbrew?
Chartbrew is a reporting platform that connects to databases and APIs and turns the data into live charts, dashboards and reports. Its README describes a chart builder, editable dashboards, embeddable charts, a query and request editor and team features. It is developed in the chartbrew/chartbrew repository and offered as a hosted service at chartbrew.com as well as source you can run yourself. Users build datasets from a connection, compose charts and KPI cards, share reports by link, embed them in other sites, and schedule email or Slack snapshots.
The project is distributed in three ways: the hosted app, the razvanilin/chartbrew Docker image that is built for each release, and a source checkout run with Node.js. The latest GitHub release is v6.0.0, published on November 2, 2026. Its notes list a new Chart Studio with live preview and AI chat, chart creation from dashboards, an Apache ECharts rendering engine, geographic map and scatter charts, watched metrics with KPI reviews, chart version history that keeps the latest 100 versions per chart, report themes and presets, chart image sharing, MCP connections together with a Chartbrew MCP server, a versioned Data API with scoped API keys, personal AI memory and usage analytics. It is a major upgrade with a breaking change: environment variables with the _DEV suffix are no longer supported, and existing cached chart data needs a documented backfill before the app is reopened. Read the v5 to v6 migration guide and back up the database and encryption keys first.
The stack is a Node.js 22 server with a React client, background workers on Redis (BullMQ), and a MySQL (5 or later) or PostgreSQL (12.5 or later) database for Chartbrew's own data. The README names Node.js 22.23.4 as the version used in the repository, CI and Docker image, with the October 2026 Node.js security fixes. Sources include PostgreSQL, MySQL, MongoDB, ClickHouse, TimescaleDB, Amazon RDS, Supabase, Firestore, Realtime Database, custom REST APIs, Strapi, Airtable, Google Analytics, Plausible, Simple Analytics, Stripe, Mailgun, Customer.io, Jira and remote MCP servers, according to the integration directory on the website.
The license is a point to read carefully. The repository applies the Functional Source License 1.1 with an MIT future license (FSL-1.1-MIT) plus a commercial license for resellers and SaaS providers. You may self-host, modify and use Chartbrew for internal use and embed dashboards in your own products, but you may not offer Chartbrew as a hosted service. Each version converts to MIT two years after its release. This is source-available rather than OSI open source, although the project calls itself open source.
Chartbrew screenshots
Explore the interface. Open a screenshot to view it at full size.
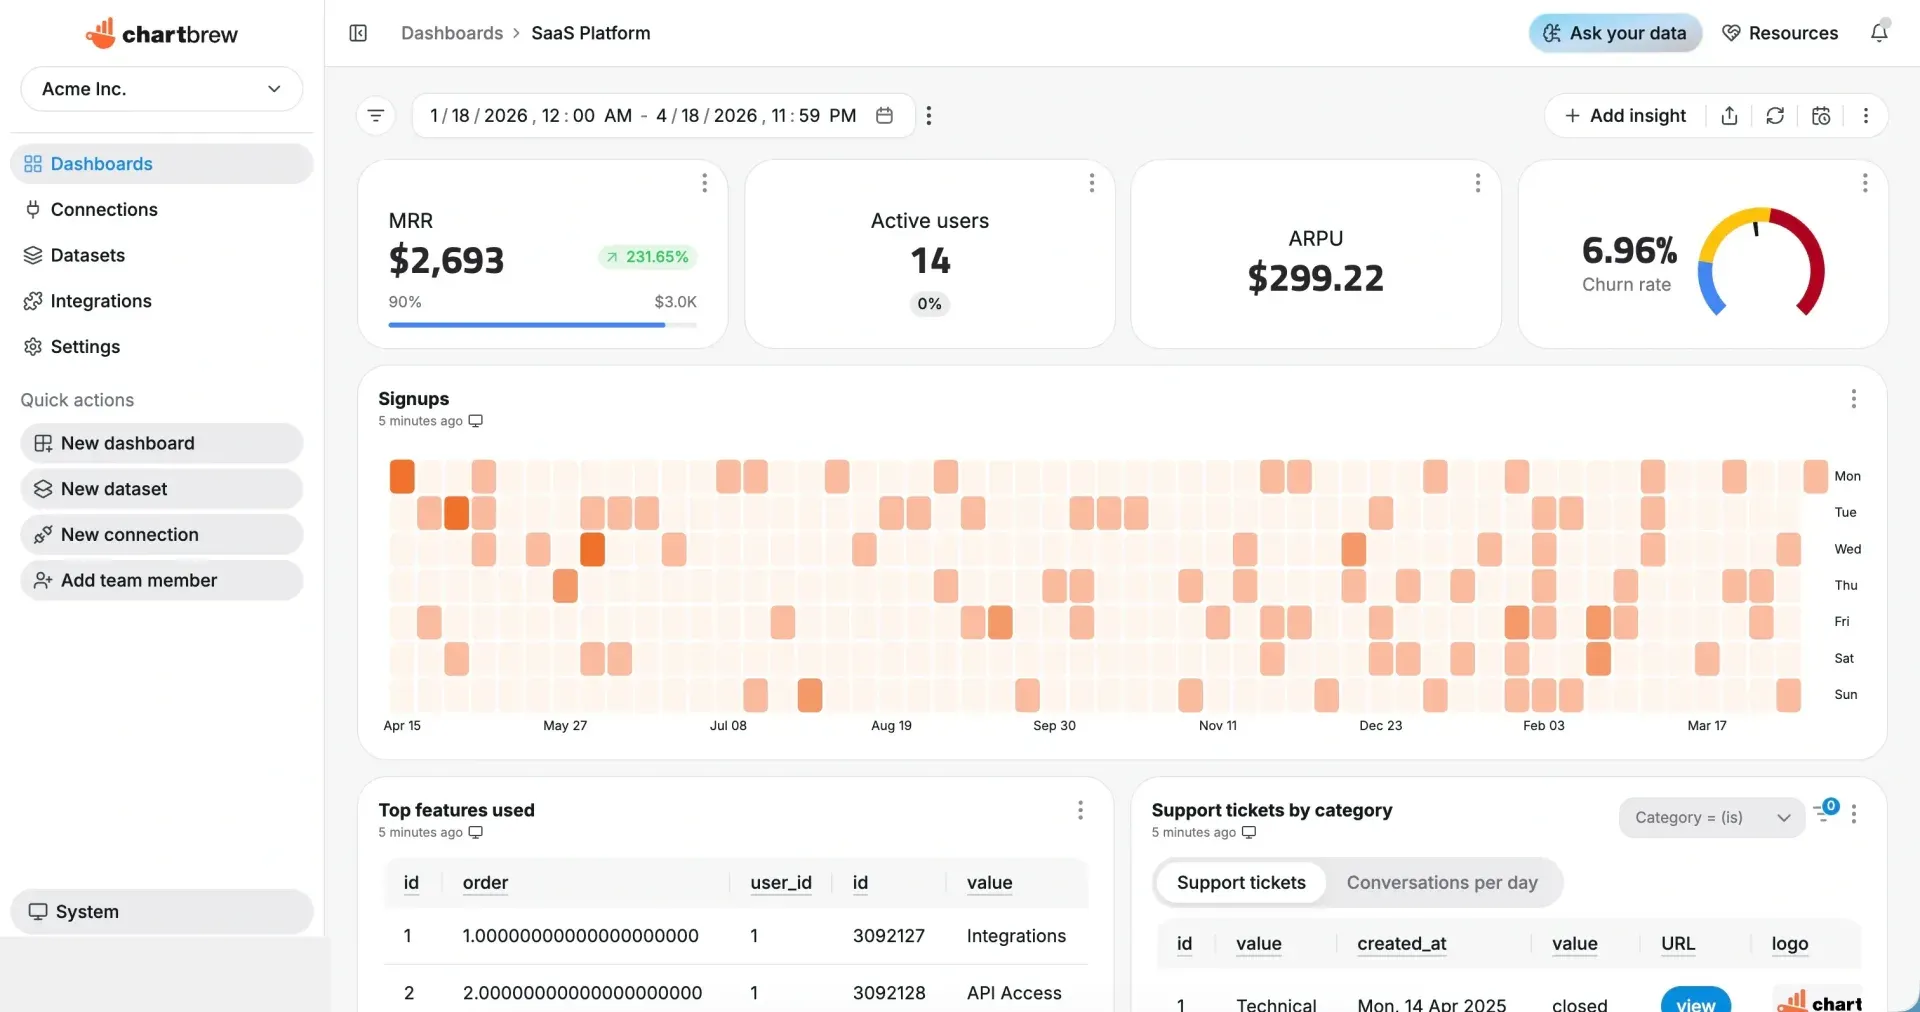
Official product screenshot of a sample SaaS dashboard. iThub covered the signed-in user name and email in the sidebar.
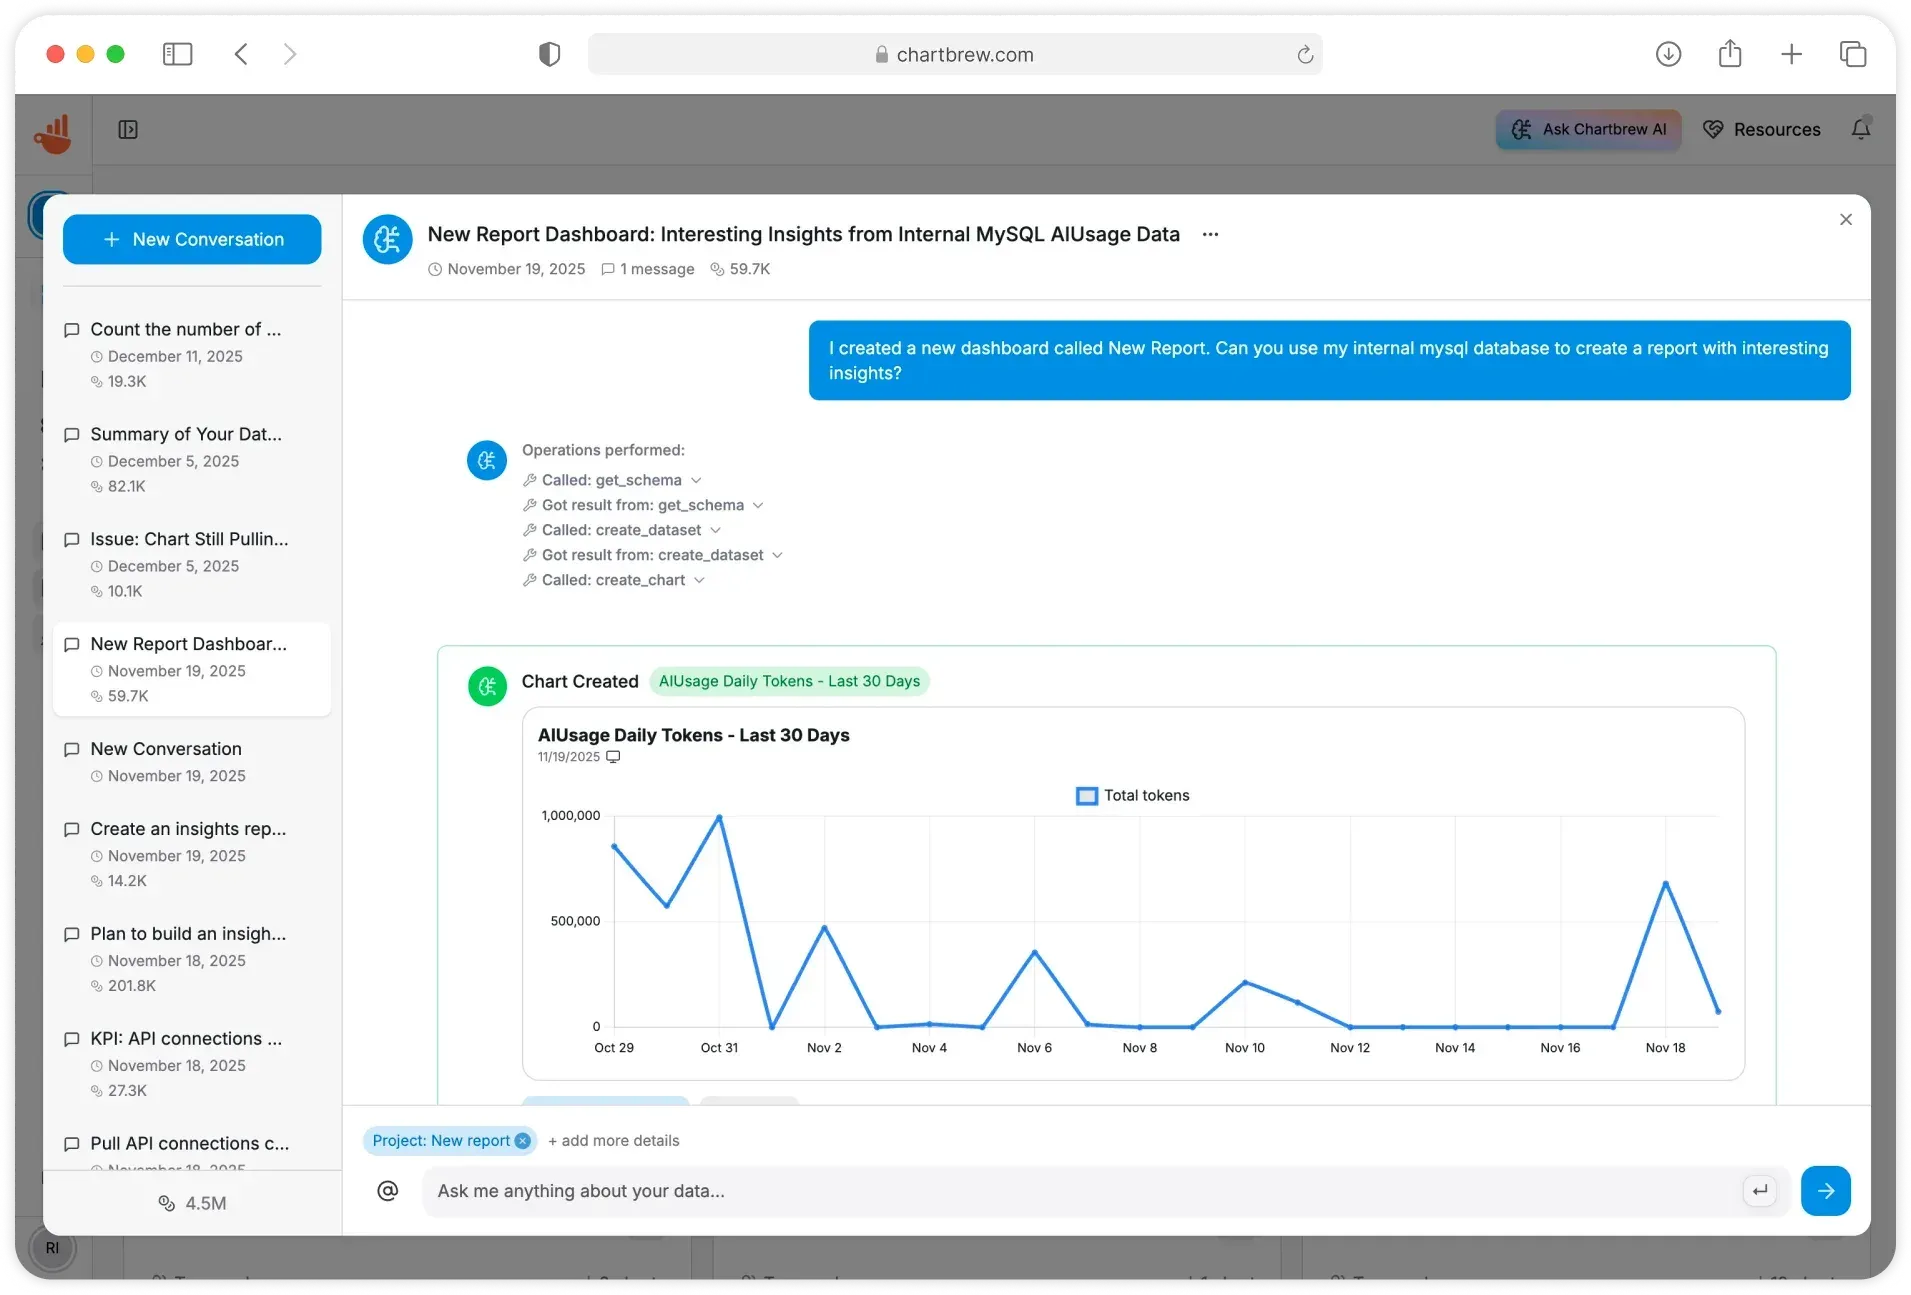
Official screenshot of the AI assistant listing its operations and creating a chart.
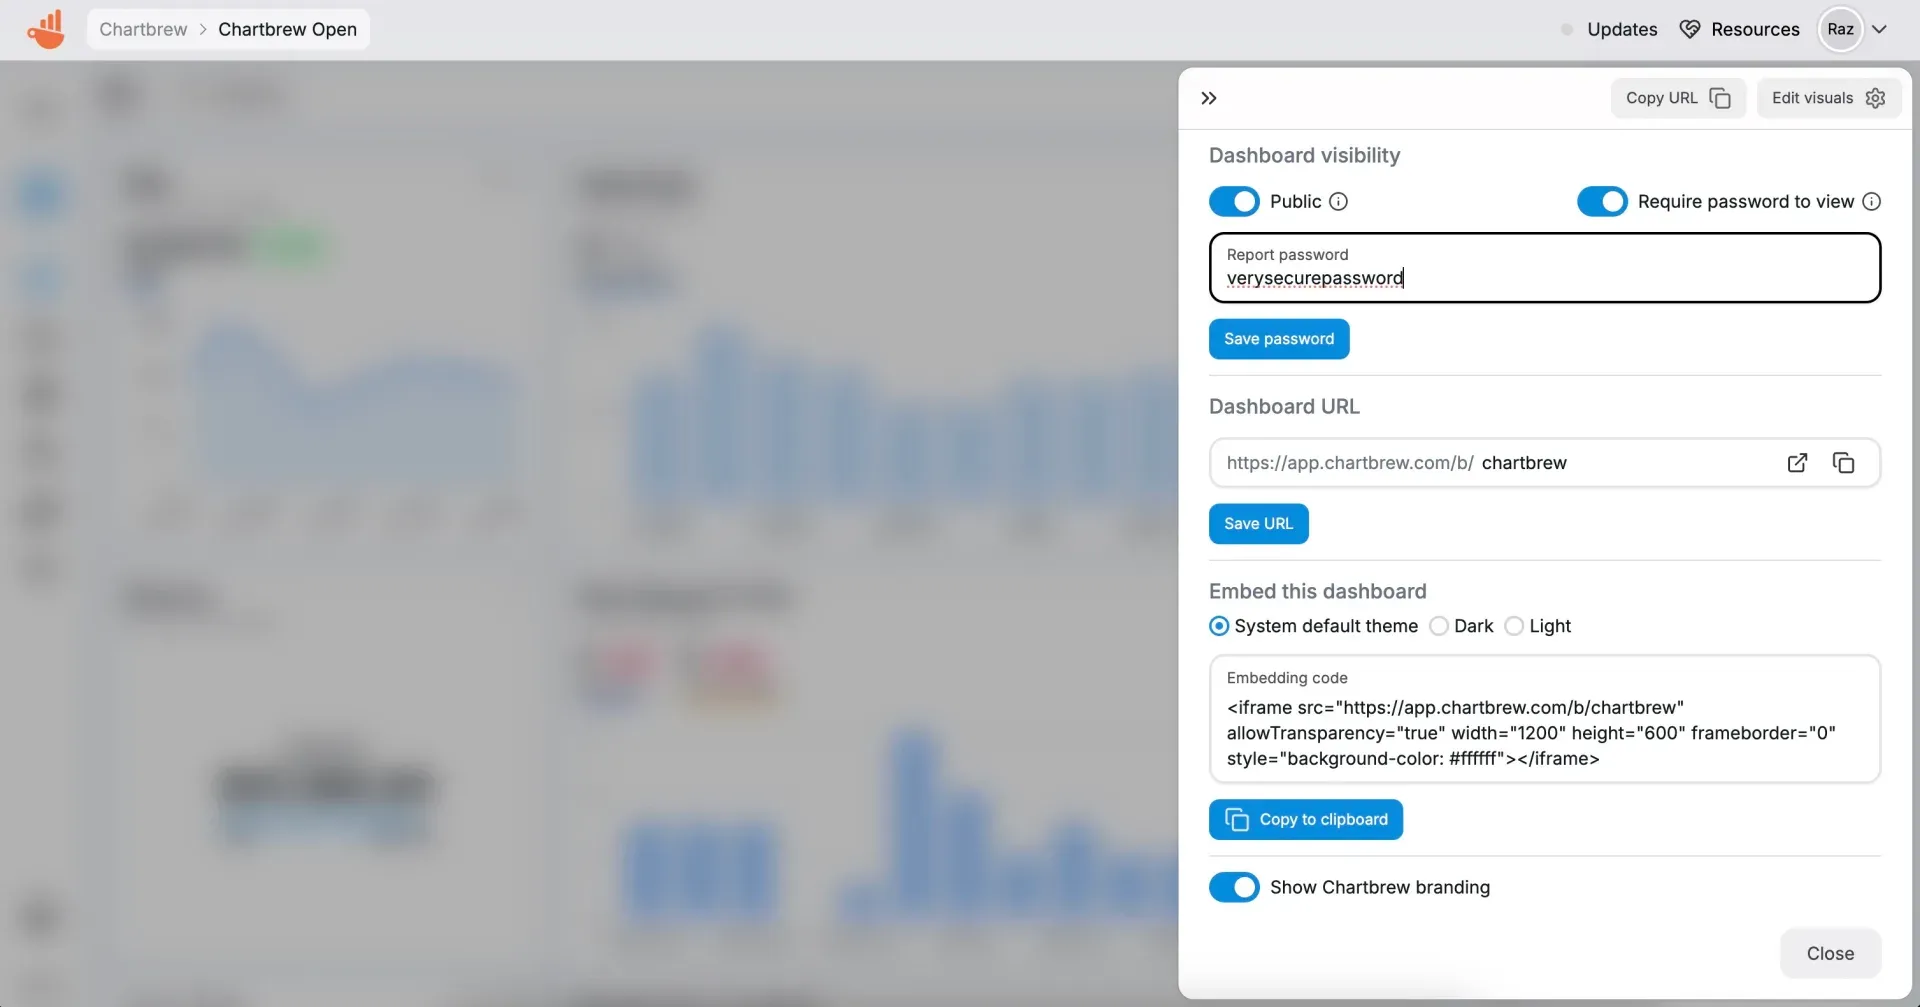
Official screenshot of the sharing and embedding settings. The password shown is a demonstration value.
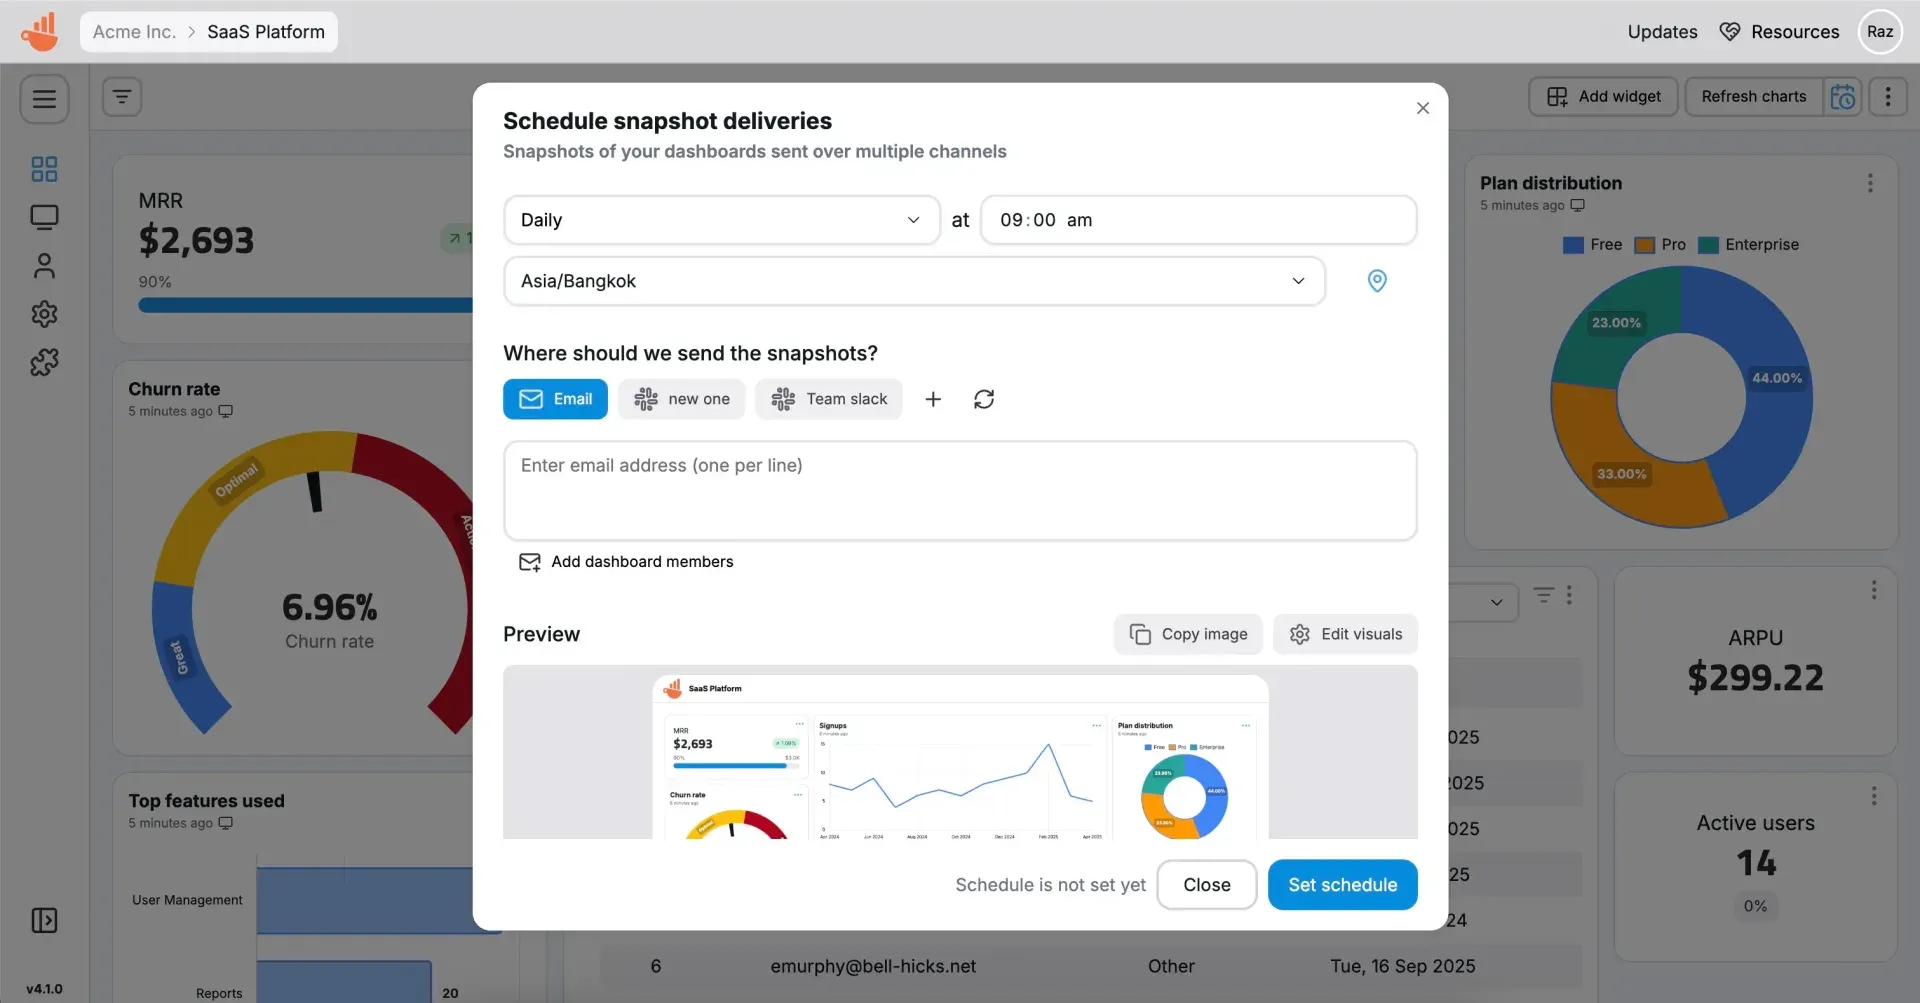
Official screenshot of the snapshot scheduling dialog over a sample dashboard.
Source: official Chartbrew project page.
Key capabilities
- Connections to databases and APIs Chartbrew connects with a connection string, API token, OAuth account or service account. Documented sources include PostgreSQL, MySQL, MongoDB, ClickHouse, TimescaleDB, Amazon RDS, Supabase, Firestore, Realtime Database, REST APIs, Strapi, Airtable, Google Analytics, Plausible, Simple Analytics, Stripe, Mailgun, Customer.io and Jira. The integration directory lists current sources and setup requirements.
- Datasets and query editor A dataset is a reusable query or API request with transformations, variables and filters. Charts and dashboards read from datasets, so one fetched result can feed several charts. Source queries counted for billing are only fresh, uncached fetches on the hosted plans.
- Chart Studio Version 6 adds a workspace with a live preview, a data view, chart settings and AI chat. Conversations stay linked to their charts so work can continue later. Charts can also be created directly from a dashboard, from an existing dataset or from a description.
- Chart types and ECharts rendering Charts render with Apache ECharts, with line, bar, horizontal bar, pie, doughnut, radar, polar, table, KPI, average and markdown charts, plus geographic maps and scatter charts added in 6.0.0. The release notes mention improved layouts, labels, tooltips and responsive sizing.
- Editable dashboards and layout controls Dashboards support drag placement, filters, pinned dashboards and shortcut icons. Version 6 preserves existing chart positions when new charts are added and adds Tidy and Auto-arrange actions with layout previews and undo.
- AI analyst The AI assistant can read a schema, create datasets and charts, and explain data. The hosted plans include monthly AI credits and optional top-ups. AI chat keeps selected charts, dashboards, datasets and connections as context, and the
/remembercommand saves personal instructions. Teams can control AI availability. - Watched metrics and KPI reviews Metrics from charts can be watched, with period comparisons including quarterly and yearly, recommendations and scheduled email summaries. A redesigned Activity area has views for changes, watched metrics, KPI reviews, alerts and data health issues.
- Alerts and anomaly detection The pricing page lists chart email alerts, Slack alerts and anomaly detection on every hosted plan. Version 6 also lets users dismiss data health issues from the Activity page.
- Sharing, embedding and passwords Reports can be public or require a password, get a custom dashboard URL, and be embedded with an iframe snippet that follows a light, dark or system theme. Embedding is explicitly permitted by the license as long as Chartbrew is not the paid product being offered. A setting controls whether Chartbrew branding appears.
- Scheduled snapshots Dashboard snapshots are delivered by email or Slack on a daily or custom schedule in a chosen time zone, with a preview and the option to add dashboard members. A snapshot is an image of the dashboard, not a live view.
- Slack app An AI agent in Slack answers questions about data in a channel or thread. Responses can include a temporary preview chart that the user then asks to add to a dashboard. The hosted pricing page lists unlimited Slack workspaces on every plan.
- Chart version history Chartbrew keeps the latest 100 versions of each chart, including changes made with AI, and lets users preview and restore earlier settings. Restoring changes chart settings, not historical source data, and does not change shared datasets.
- Report themes and presets Six built-in themes and custom presets with light and dark colors can be applied to other reports, which helps keep client-facing reports consistent.
- Chart image export Charts can be copied or downloaded as images with controls for size, theme, background and visible details, without enabling a public link. An authenticated PNG rendering endpoint supports automation. Image export supports graphical, KPI and average charts, not tables or markdown.
- Data API and scoped keys Version 6 adds a versioned Data API that returns dataset results and chart data through authenticated endpoints, with scoped API keys, project access controls, filters, variables and cache information. See the documentation for endpoints.
- MCP in both directions Remote MCP servers such as PostHog, Linear, Sentry, Notion, Stripe, Mixpanel and Supabase can be connected as data sources, with OAuth and read-only tool approval. Compatible AI tools can also connect to Chartbrew to search resources, read data and create chart previews within the permissions granted.
- Client accounts and team roles Teams invite members with project access controls. The Growth and Professional hosted plans include 20 and 100 client accounts for sharing reports with customers, and the Professional plan adds audit logs.
- Self-hosting with Docker or Node.js The Docker image needs a running MySQL or PostgreSQL database, Redis, a 32-byte
CB_ENCRYPTION_KEY, and basic-auth credentials for the BullMQ admin dashboard at/apps/queues. A source install usesnpm run setupand a.envfile. The Docker guide has the full command, and DigitalOcean and Hostinger deploy buttons in the README are affiliate links.
Where Chartbrew fits
Building a client reporting portal
Connect each client data source, build one dashboard per client or use client accounts on a plan that includes them, and share a password-protected link or an embed. Check which charts each client may see, and confirm that a shared report never exposes datasets or filters beyond the intended project.
Putting live charts inside your own product
Embed dashboards with the iframe snippet or use the Data API for charts rendered by your own front end. The license allows embedding while Chartbrew is not the primary paid product, so confirm the arrangement with the maintainers before reselling a reporting feature built on it.
Reporting on product and revenue metrics
Connect the application database, a payments source such as Stripe and an analytics source, then watch the key metrics and schedule a weekly KPI summary. Review how period comparisons are calculated and verify the first few numbers against a direct SQL query before sharing the report.
Asking questions of data with AI or MCP
Use Chart Studio chat or the Slack agent to explore a dataset, then save the useful chart. Review the generated query and the connection permissions, since AI exploration counts toward data requests on hosted plans, and limit access to the sources the assistant may read.
Sending scheduled dashboard snapshots
Schedule an image of a dashboard to email recipients or a Slack channel at a fixed time and time zone. Check that the sender address, the recipients and the data freshness are what you expect, because a snapshot reflects the last refresh rather than a live query.
Upgrading a self-hosted instance to version 6
Back up the database and keep the existing encryption keys, rename every _DEV environment variable, update the Node.js runtime, run migrations and the prepared snapshot backfill, then review the backfill report for charts that need attention. Test a staging copy before upgrading production, and restart all API instances and workers.
Reviews of Chartbrew
Be the first to share your experience with Chartbrew.
Write a review
Loading review form…
Alternatives to Chartbrew
 MetabaseMetabase is open-source business intelligence for asking questions of your database, building dashboards and embedding analytics. Run the AGPL edition yourself with Docker or the JAR, or use paid Cloud, Pro and Enterprise plans.
 RedashRedash is an open-source tool where SQL users query data sources, build visualizations and dashboards, schedule refreshes and set alerts in the browser.ASApache SupersetApache Superset lets analysts and business users explore SQL data, build charts without code, and create dashboards. It supports self-managed deployment, configurable access controls, and a REST API.