

What is PostHog?
PostHog is a product platform that ingests and stores analytics events, session recordings, errors, logs and business data, then exposes them to people and to AI agents through a web app, SQL, an API and an MCP server. The project describes itself as a context layer for a product: the same data that feeds funnels and dashboards is available to PostHog AI, to Slack and to coding tools. It is made by PostHog Inc., which started in Y Combinator's W20 batch and launched its first version in 2020.
The product suite is broad. The main repository lists product analytics, web analytics, group analytics, session replay, heatmaps, error tracking, logs, tracing, feature flags, experiments, surveys, support, workflows, a data warehouse, data pipelines, API endpoints, AI observability and an agent-driven "self-driving" inbox. Several of these are marked beta in the README. You choose which products to switch on; each has its own free monthly allowance and its own usage billing.
PostHog is distributed in three ways. PostHog Cloud US and PostHog Cloud EU are the hosted service and the route the project recommends. A one-line "hobby" Docker deployment is available for Linux for people who want to self-host, with the documented caveat that it is unsupported and sized for roughly 100,000 events per month. PostHog Desktop is a separate downloadable app for macOS, Windows and Linux, and it is the component that carries the GitHub release tags.
That last point explains the version shown on this page. The repository does not tag versions of the platform itself: the self-host documentation states that changes ship continuously from the master branch to Cloud and to the latest Docker image, and that no CVEs are published because there are no platform versions. The latest GitHub release is desktop-v0.61.963, a PostHog Desktop build, and it is listed here as the nearest versioned artifact.
The source is under the MIT expat license, except the ee directory, which has its own enterprise license that requires agreeing to the PostHog Subscription Terms of Service for production use. The project also maintains a separate posthog-foss repository with the proprietary code removed.
PostHog screenshots
Explore the interface. Open a screenshot to view it at full size.
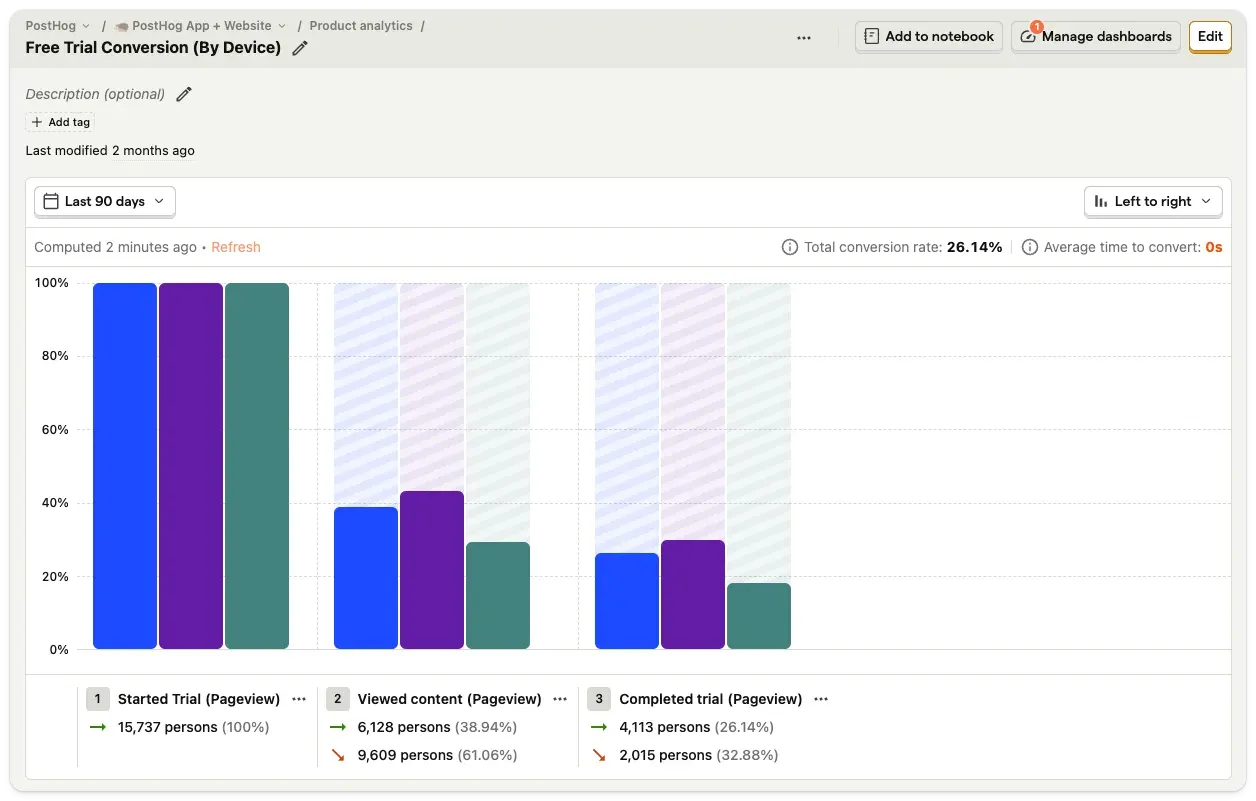
Official docs screenshot of a funnel insight with conversion rate and a device breakdown.
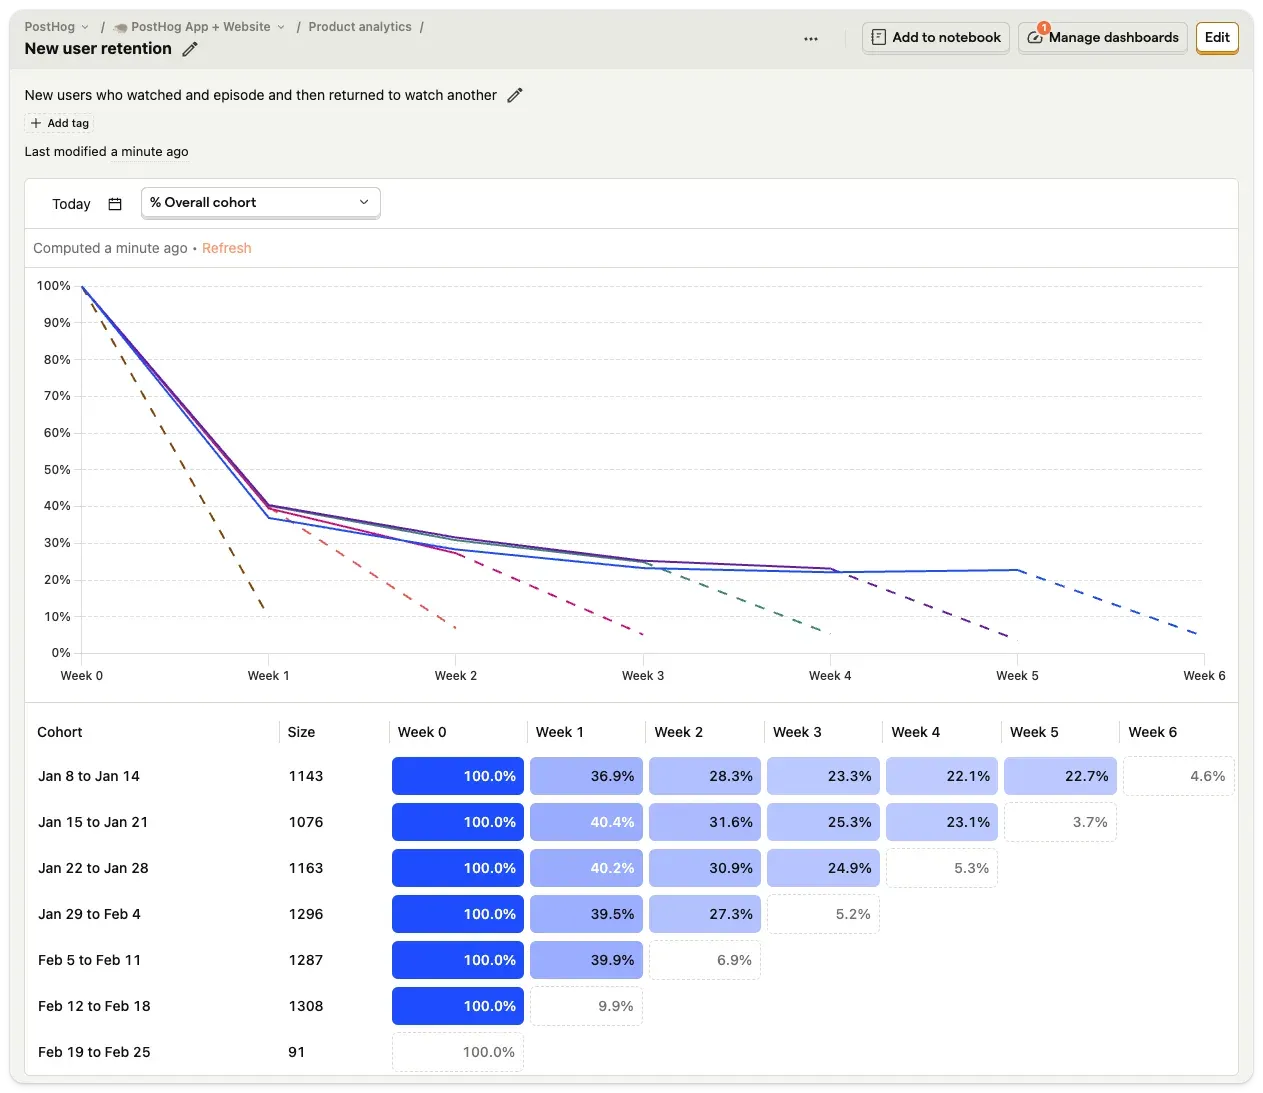
Official docs screenshot of a weekly cohort retention table and curve.
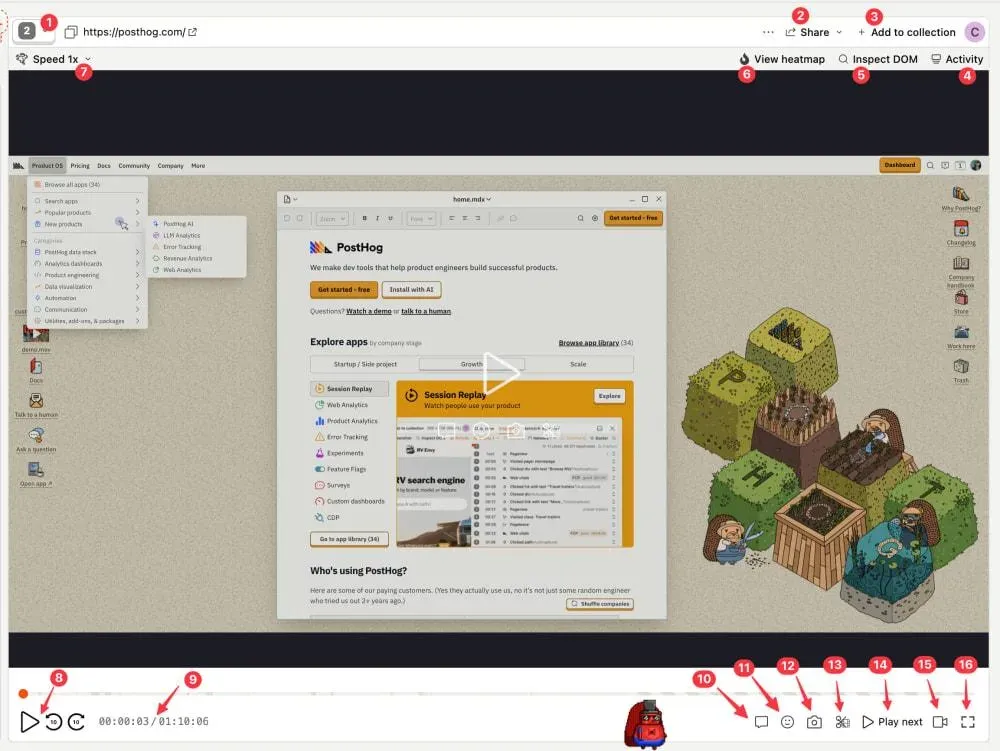
Official docs figure of the session replay player and its controls.
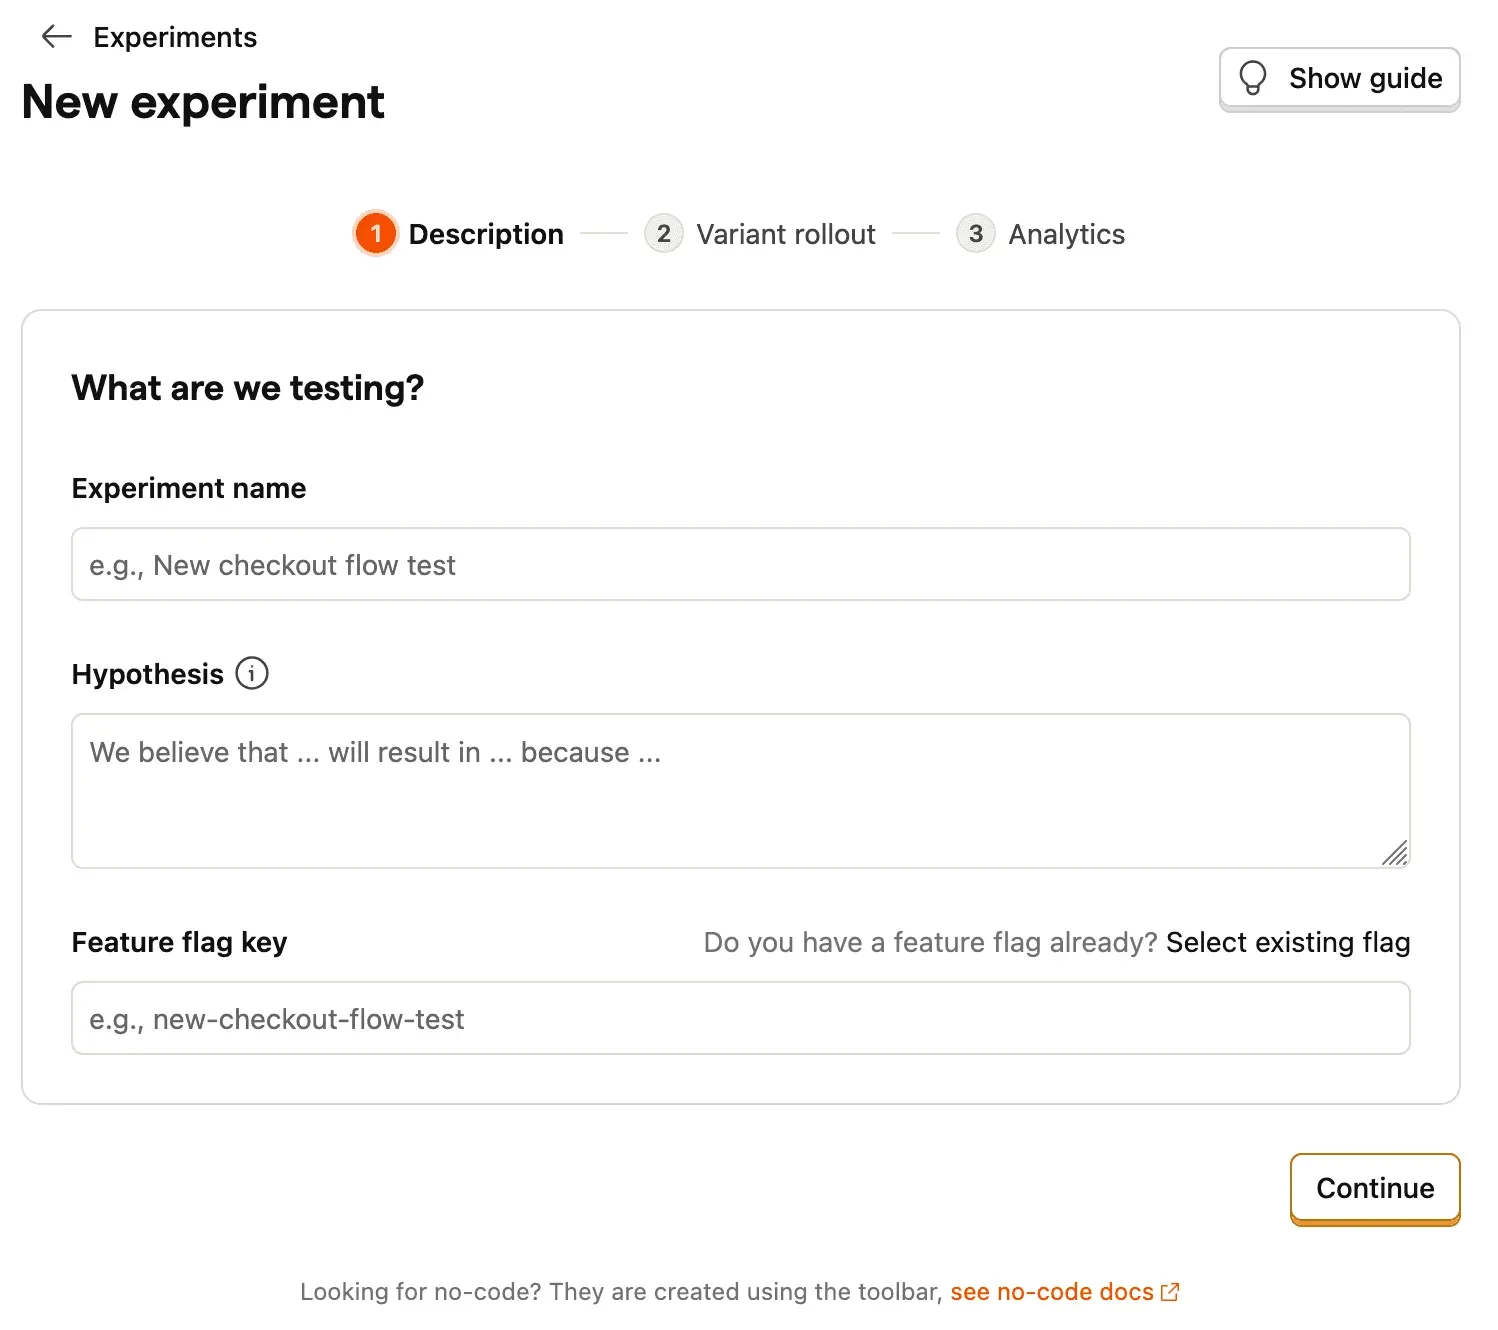
Official docs screenshot of the first step of the experiment wizard.
Source: official PostHog project page.
Key capabilities
- Product analytics Event-based analytics with autocapture or manual instrumentation, shown as trends, funnels, retention, lifecycle and stickiness insights. Results can be explored with visualizations or written as SQL. Funnels report conversion between steps and breakdowns, such as by device, in the same view.
- Web analytics A dashboard in the style of a traditional web analytics tool for traffic, sessions, conversion, web vitals and revenue. It reads the same events as product analytics, so a team does not run a second tracker for page views.
- Group analytics Analysis at the level of accounts, organizations or other groups instead of single users. This matters for multi-seat B2B products where a company, not a person, is the unit that adopts or churns.
- Session replay Recordings of real sessions from websites and mobile apps, with a player, playlists, console and network context, and links back to the events in the session. The documentation covers how to watch recordings and filter them. Replay Vision adds AI-generated observations over recordings and is billed in credits.
- Heatmaps Click, scroll and mouse-movement maps for pages, which the README lists in the replay group. Use them to check whether an element that looks important is being reached at all.
- Error tracking Collects exceptions, groups them into issues, sends alerts and supports resolving them. The free monthly allowance on the pricing page is 100,000 exceptions. Exception autocapture is set up through the SDK, as the installation guide explains.
- Logs and tracing Log ingestion with search next to product data, and distributed tracing aimed at finding the code behind a failure. The pricing page lists 10 GB of ingested logs in the free allowance. These are newer products than analytics and replay, so check their maturity for your own volume.
- Feature flags Boolean release toggles, multivariate flags with rollout percentages for A/B/n tests, and remote config payloads, with release conditions evaluated from top to bottom by user or group properties. The free allowance is 1 million flag requests a month.
- Experiments A guided setup for hypotheses, variant rollout and analytics, built on a feature flag, plus a no-code route through the toolbar. Statistical results are reported against goal metrics you pick, so define those metrics before launching.
- Surveys, support and workflows No-code survey templates and a survey builder, a chat widget and a unified inbox for support, and workflows that send messages or trigger actions from product data. The free tiers are 1,500 survey responses and 10,000 workflow messages per channel.
- Data warehouse and pipelines A managed warehouse with 120+ sources, a SQL editor with BI charts, and data pipelines with 25+ destinations or any webhook, plus batch export to your own warehouse. Custom API endpoints can be built on top of PostHog data.
- AI observability Captures traces, generations, latency and cost for LLM-powered applications and runs LLM-as-a-judge evaluations. A related MCP analytics beta shows how agents use your own MCP server. The free allowance is 100,000 events a month, shared with evaluations.
- PostHog AI and self-driving inbox PostHog AI answers questions about product data, builds insights, writes SQL and finds replays. The self-driving feature turns signals such as errors, rage clicks and failed queries into reports and pull requests for review. Both draw on credits on the pricing page, and generated code should be reviewed like any other contribution.
- SDKs and setup wizard Libraries for JavaScript, React, Next.js, Vue, React Native, Android, iOS, Flutter, Python, Node, PHP, Ruby, Go and .NET, with guides for Django, Angular, WordPress and Webflow. The wizard, run with
npx -y @posthog/wizard@latest, installs and configures PostHog in an existing app. - Remote MCP server
https://mcp.posthog.com/mcproutes to the US or EU data region when a person logs in. It can be added to Claude Code, Cursor, Codex, VS Code, Zed or PostHog Desktop withnpx @posthog/wizard mcp add. Treat the connection as access to production analytics data. - Self-hosted hobby deploy A one-line script installs a Docker Compose deployment on Linux, with 4 GB of memory recommended. Upgrades use a matching script, and a beta installer binary is offered as an alternative. All paid-plan features are Cloud only, and the project provides no support or guarantees for self-hosted instances.
- PostHog Desktop A desktop app distributed through GitHub releases as DMG and ZIP for macOS (Apple Silicon and Intel), an EXE for Windows x64, and AppImage, DEB and RPM packages for Linux. It is the surface behind the repository's release tags and is described as beta on the pricing page.
- Platform packages SSO, audit logs, custom roles and project permissions are sold as platform packages for teams that need to manage access. Annual plans and volume discounts are available through sales, as described on the pricing page.
Where PostHog fits
Measuring activation and retention
Instrument a small set of events that define a successful first session, then build a funnel from sign-up to that milestone and a retention insight over weekly cohorts. Break the funnel down by device or plan to find where drop-off differs. Check that autocapture is not producing duplicate or noisy events before sharing the dashboard. Agree on event and property names in writing, because renaming them later splits history across two series.
Diagnosing a broken flow with replay and errors
Start from an error-tracking issue or a funnel step with high drop-off and open the linked recordings. Watch several sessions rather than one, and look at console and network context. Confirm that sensitive fields are masked in your SDK configuration before recording production users. Then link the recording to the exception event so that engineering and product work from the same evidence.
Rolling out a feature behind a flag
Create a flag with release conditions for an internal group first, widen the percentage in steps and watch error and conversion insights at each step. Keep a rollback condition written down. Decide how long flags live so that stale conditions do not stay in code. Use the same flag as the exposure source for the analytics you read afterward.
Running an A/B experiment
Use the experiment wizard to attach variants to a flag, choose a primary goal metric and run until the planned sample is reached. Avoid changing the metric after launch. Check the experiment guide for how exposure is recorded.
Monitoring an LLM-powered feature
Send traces and generations from the application to AI observability and review latency, cost and failures per request. Add an LLM-as-a-judge evaluation for a known failure type and track it over time. Be deliberate about whether prompts and outputs containing user data are captured.
Self-hosting for a small internal tool
For low volume and strict data location needs, deploy the hobby stack on a Linux host with 4 GB of memory, put it behind a reverse proxy and plan upgrades with the upgrade script. Test restore of the volumes first, because the project offers no support or data-loss guarantees for this route.
Install
npx -y @posthog/wizard@latestReviews of PostHog
Be the first to share your experience with PostHog.
Write a review
Loading review form…
Alternatives to PostHog
 UmamiUmami is an MIT-licensed web and product analytics platform: a small cookieless tracker feeds traffic, events, funnels, retention, revenue, session replay and heatmap reports. Self-host it with Node.js and PostgreSQL or use Umami Cloud.
 GrowthBookGrowthBook combines feature flags, warehouse-native experimentation and product analytics, as a cloud service or self-hosted with Docker Compose.
 SentrySentry is a Fair Source debugging platform that groups errors into issues and adds traces, logs, session replays, profiles, cron and uptime monitors. It runs as the sentry.io service with US or EU storage, or self-hosted with Docker Compose.