
What is Tracexy?
Tracexy is a network analysis application for macOS made by Rockxy LLC and published in the RockxyApp/Tracexy repository. The project describes it as a native, session-first Wireshark alternative for macOS. It captures traffic passively, or opens saved PCAP and PCAPNG files, and groups frames into sessions and correlated activities: which process contacted which host, which protocols appeared, how much data moved and what evidence supports each grouping. Decoded protocol fields and raw hex remain available one click below the session view.
The application is written in Swift with SwiftUI and AppKit and requires macOS 14 or later. Live capture uses libpcap through a privileged helper that exposes only typed capture operations over an XPC connection with code-signing checks; opening saved capture files does not need the helper or administrator access. Process ownership comes from pktap metadata with a local socket-to-process fallback, and missing process, hostname or protocol evidence is shown as unknown. The interface is available in English and Vietnamese.
Tracexy is distributed in two ways. The public source edition in the repository is licensed under AGPL-3.0-or-later and can be built with Xcode 16 and an Apple Developer Team for signing. Rockxy LLC also publishes a notarized DMG on the Tracexy website and a Homebrew cask. The free Community edition covers capture, sessions, protocol analysis, History, Findings, the MCP tool and a local AI assistant. A paid Pro license, listed on the pricing page as a one-time purchase in Personal, Multi-Mac and Lifetime options, adds capture comparison, cross-capture search, batch analysis, scheduled capture, custom finding rules, reports and larger workspace limits. Contributions require a contributor license agreement.
The latest release is 0.9.2 (build 17) from October 21, 2026, which added the License settings pane to the official download so Pro keys can be activated. Version 0.9.0 from October 8, 2026 was a large feature release: named workspace tabs, Session Expressions and filter macros, a frame browser with checksum validation, Follow Stream for TCP and UDP with HTTP/1, cleartext HTTP/2 and WebSocket reading, Statistics views, evidence-linked findings, IPv4 and IPv6 reassembly, GRE and VXLAN tunnels, SIP/RTP, SMB, LDAP and Kerberos decoding, local GeoIP, rotating capture files and a command line. Unreleased work in the changelog adds hex dump import, Frame Expressions, coloring rules that import Wireshark color filters and SCTP sessions.
The README lists deliberate limits: no TLS or QUIC decryption in the source edition, no general always-on TCP reassembly, no deep HTTP/2, HTTP/3 or WebSocket decoder, and History that stores capture and session summaries rather than raw packets. Tracexy is part of the Rockxy family next to the Rockxy HTTP debugging proxy and Shieldxy. A cross-platform desktop traffic monitor on iThub is Sniffnet.
Tracexy screenshots
Explore the interface. Open a screenshot to view it at full size.
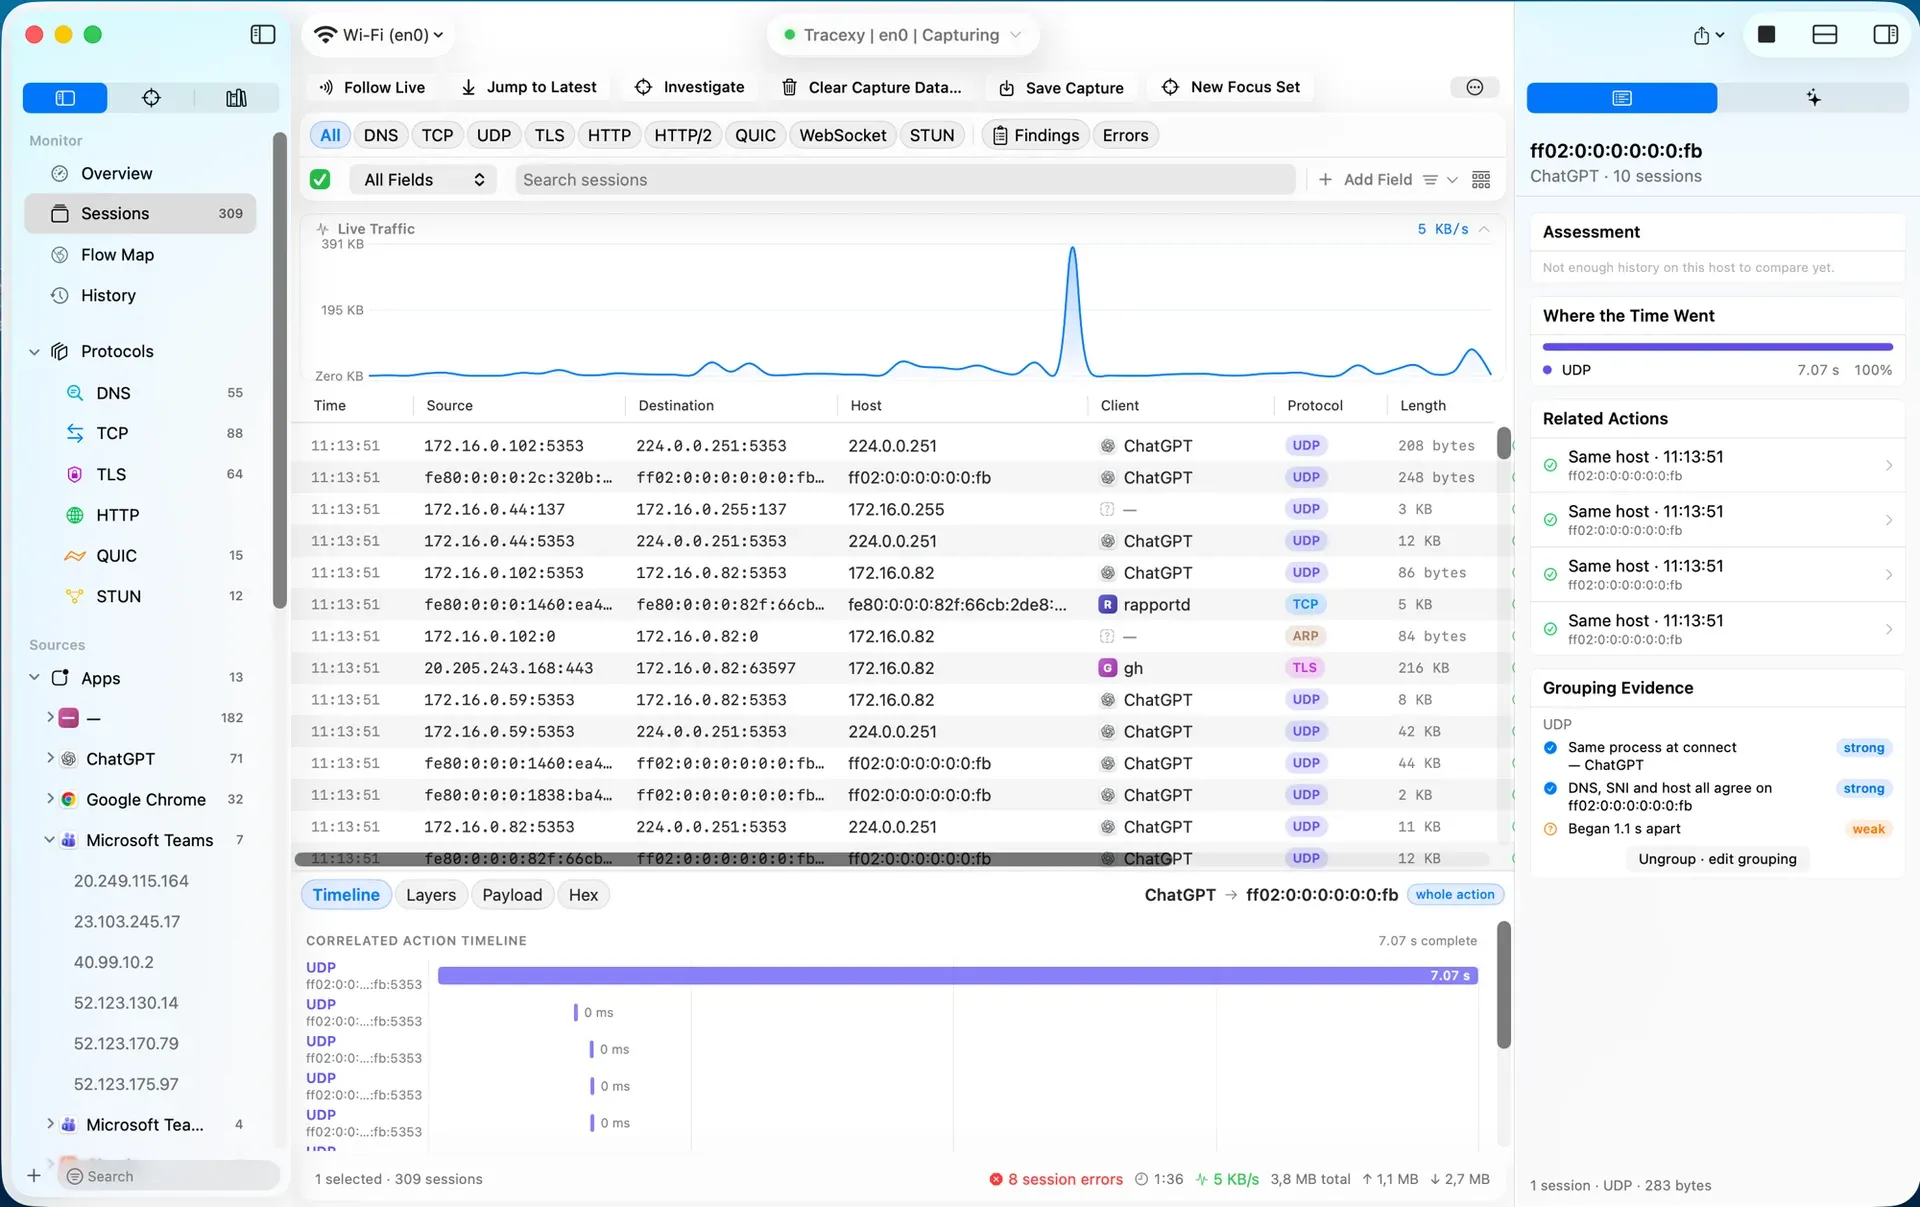
Sessions workspace during a live capture, with app sources in the sidebar and grouping evidence for the selected session.
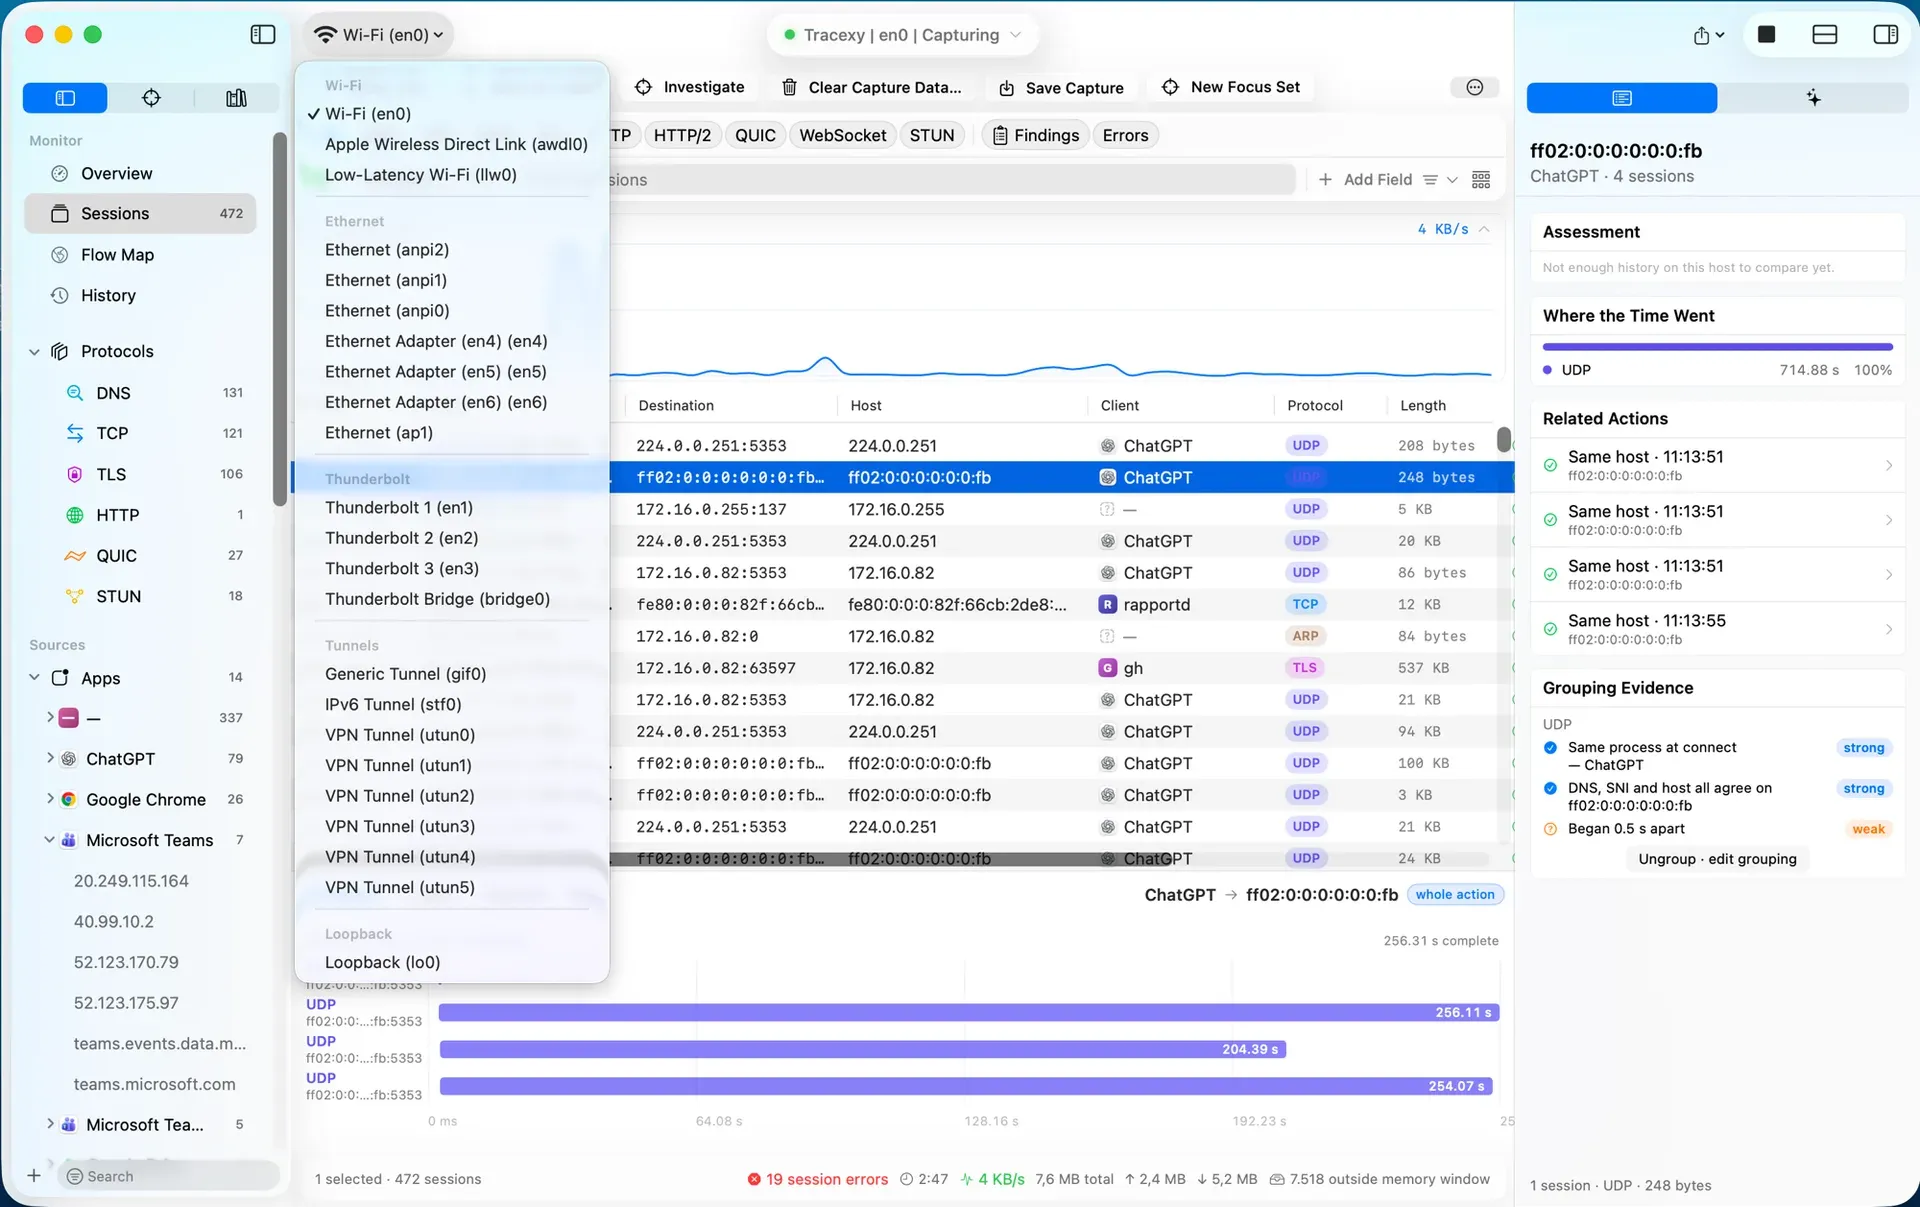
Interface picker with Wi-Fi, Ethernet, Thunderbolt, tunnel, VPN tunnel and loopback sources.
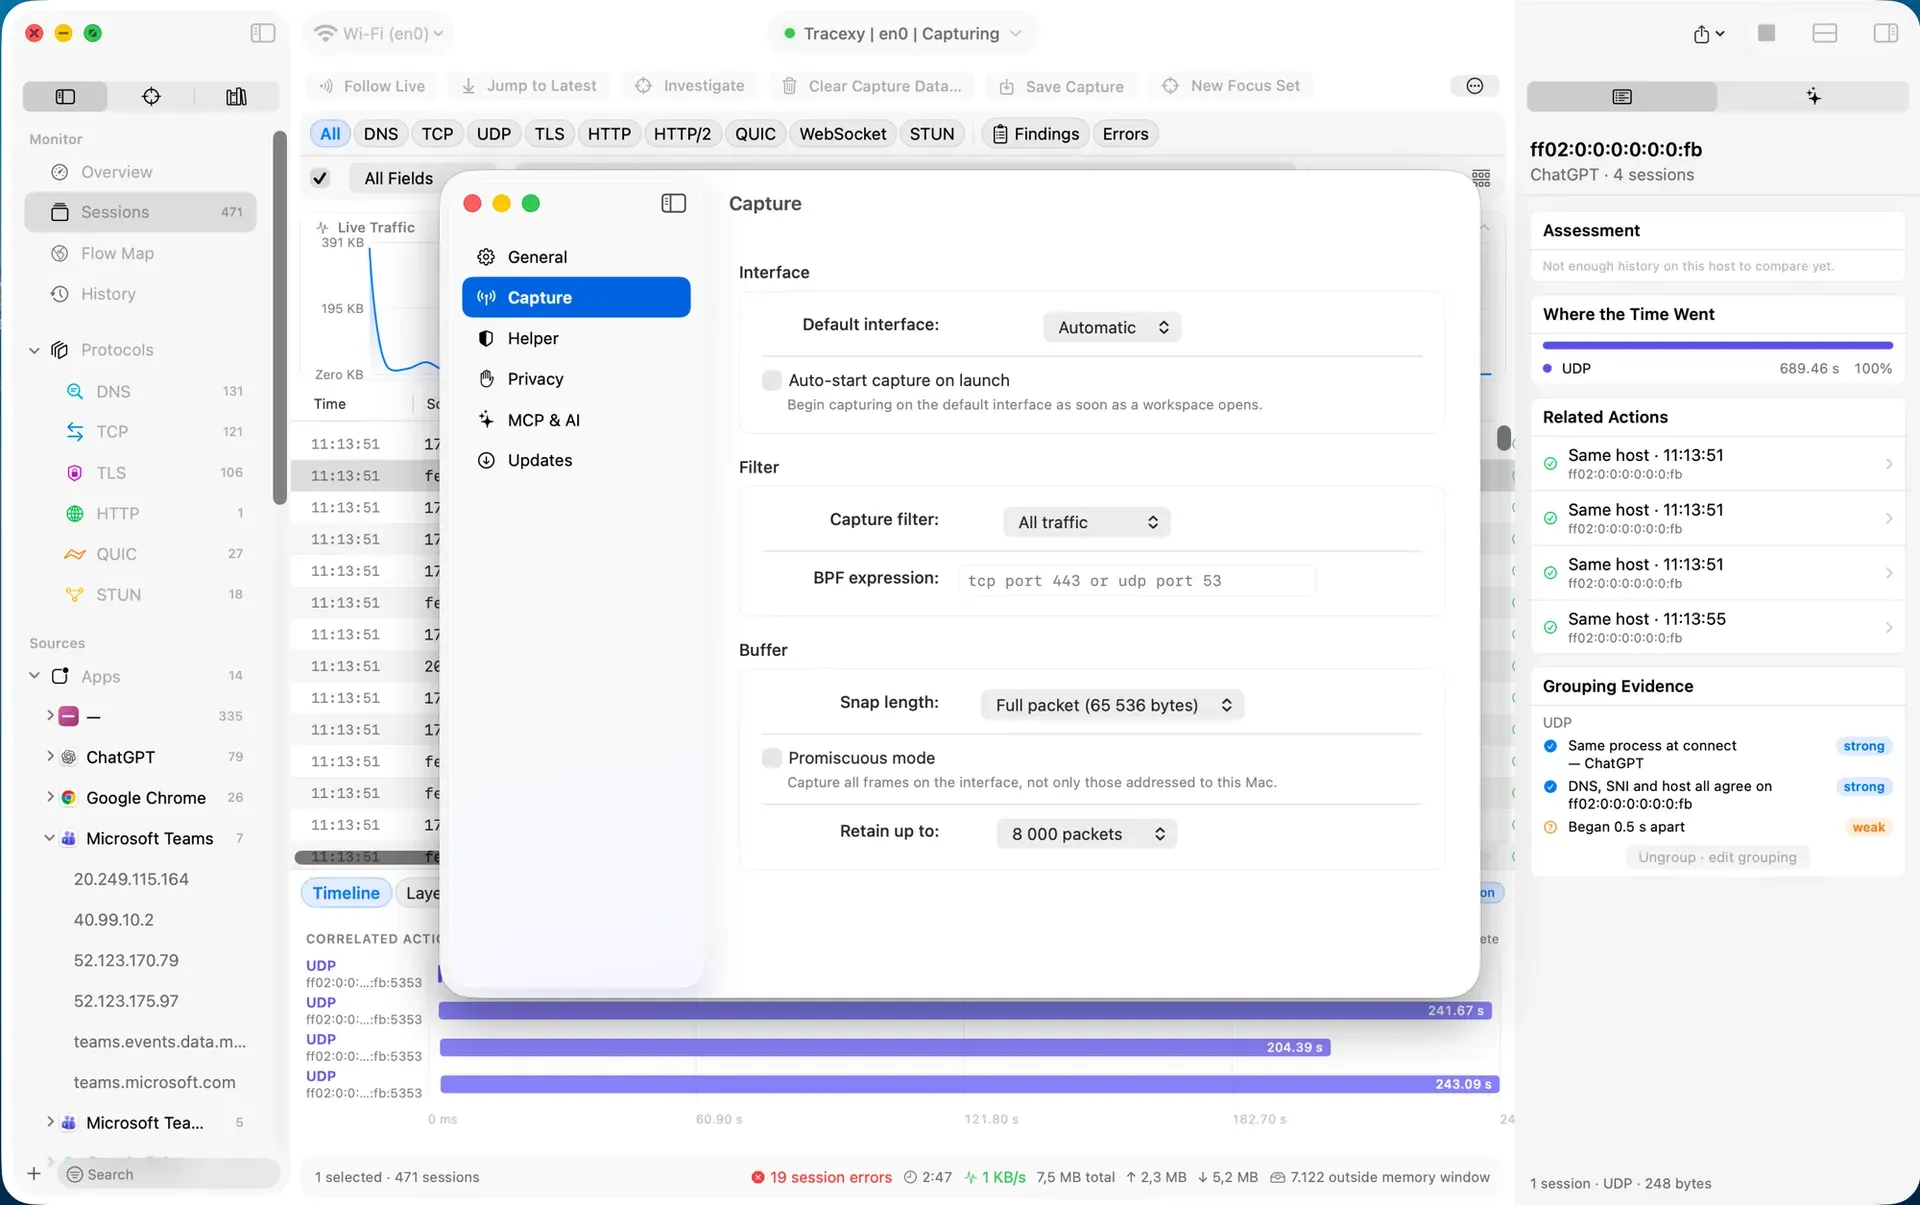
Capture settings: default interface, auto-start, BPF filter, snap length, promiscuous mode and retention limit.
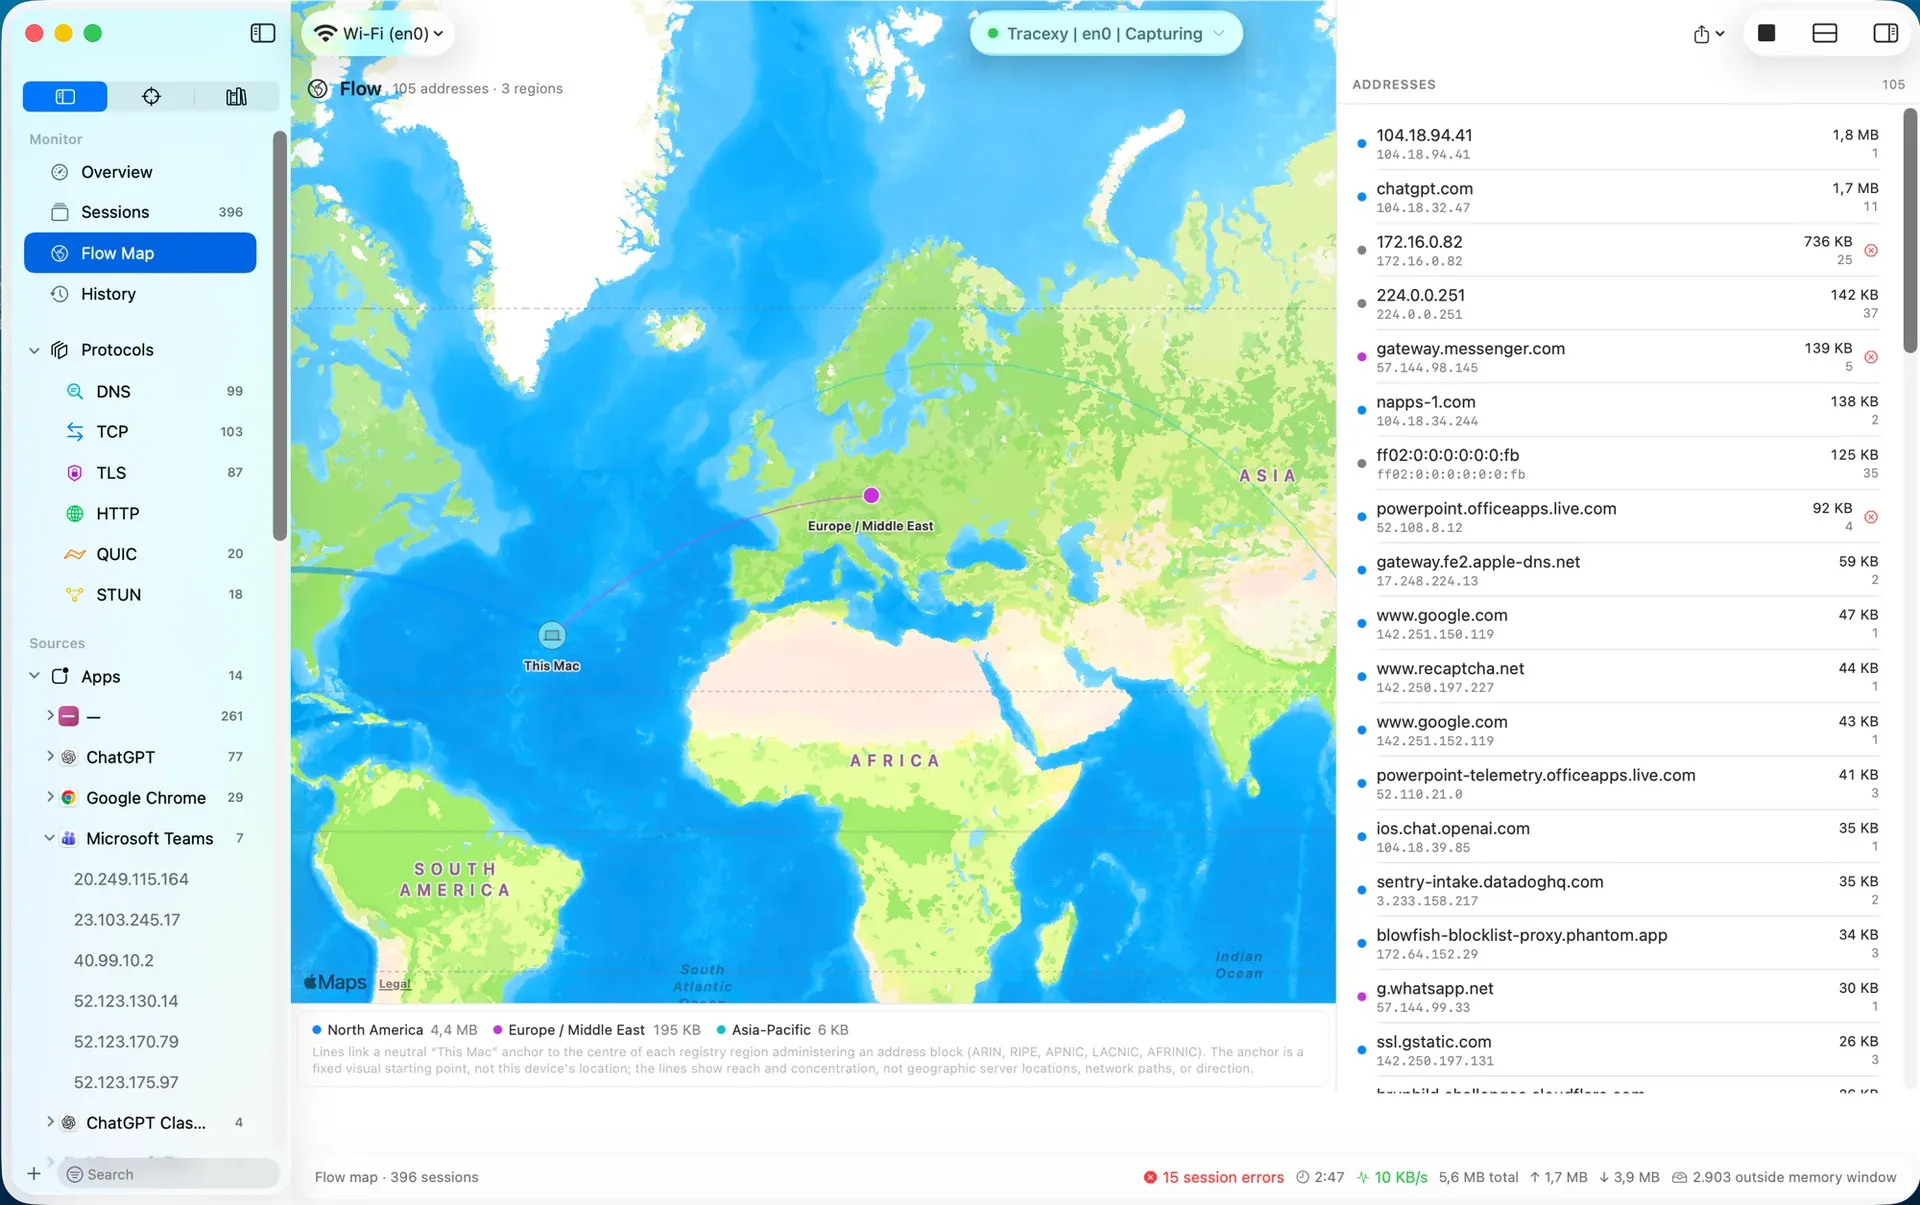
Flow Map grouping 105 destination addresses by registry region, with traffic per address in the side list.
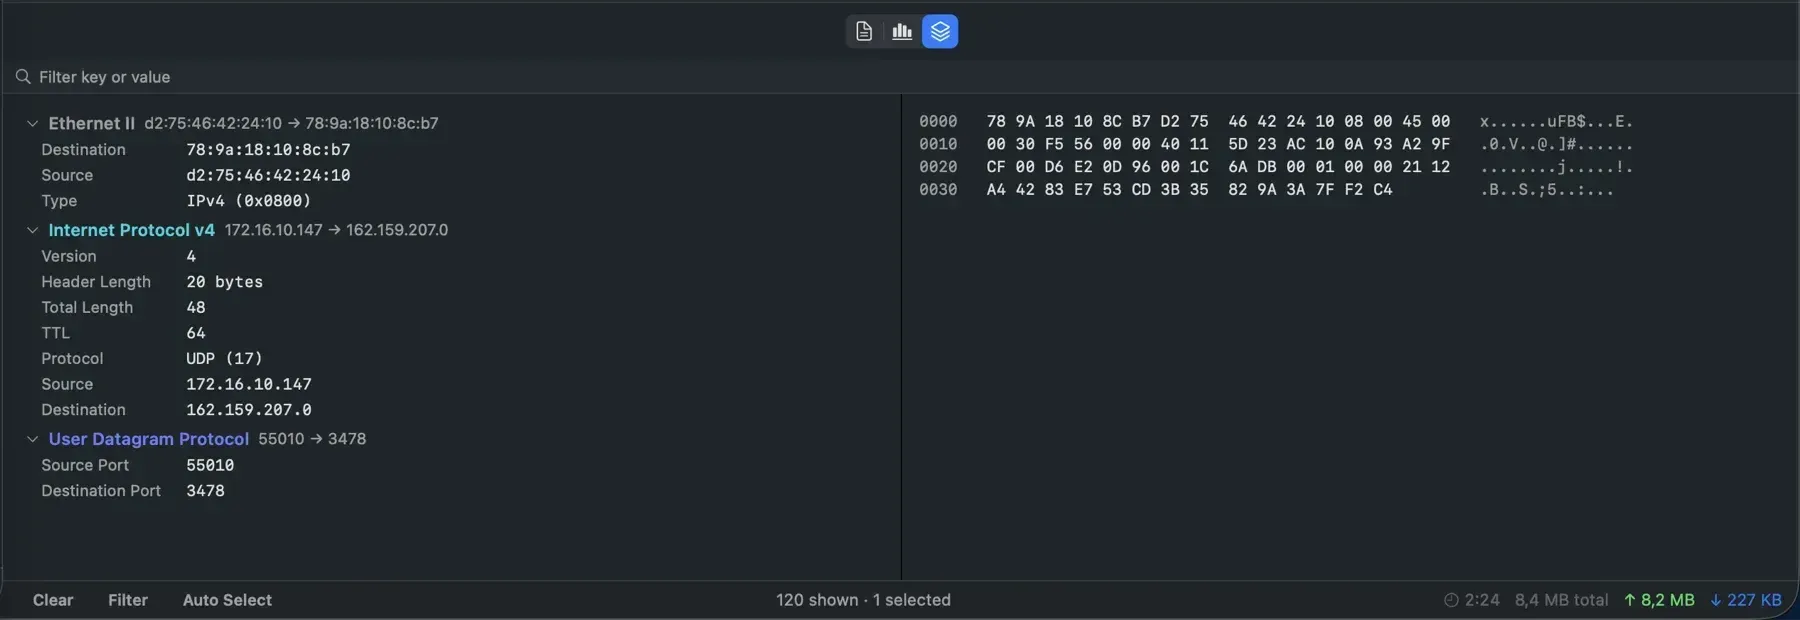
Packet inspector with decoded Ethernet, IPv4 and UDP fields next to the raw hexadecimal bytes.
Source: official Tracexy project page.
Key capabilities
- Live capture on Mac interfaces Capture runs through libpcap and a privileged helper that needs one-time approval in System Settings. The interface picker lists Wi-Fi, Ethernet adapters, Thunderbolt ports and bridges, generic and IPv6 tunnels, VPN tunnels and loopback. Capture settings include a default interface, BPF filter expressions, snap length, promiscuous mode, packet retention, autostop by time or packet count and rotating file sets.
- Capture files Tracexy reads and writes PCAP and PCAPNG and imports gzip, LZ4, TCP Viewer archives and Linux cooked captures. Files can be merged, split and exported with address replacement. Raw exports preserve the captured bytes and require acknowledgement while privacy protections are enabled.
- Session-first workspace Bidirectional traffic is grouped by a direction-normalized five-tuple, so one conversation stays together with its byte and timing summaries. The session table shows time, source, destination, host, client app and protocol, with protocol tabs for DNS, TCP, UDP, TLS, HTTP, HTTP/2, QUIC, WebSocket and STUN. A live traffic graph sits above the table.
- App and process attribution The sidebar groups sessions by the app that opened them, using
pktapmetadata and a local socket-to-process fallback. Related DNS, TCP, TLS and HTTP observations can be correlated into one activity, with a grouping evidence panel that rates each signal as strong or weak and allows ungrouping. - Protocol decoding Supported layers include Ethernet with VLANs, loopback, GRE and VXLAN tunnels, ARP, IPv4 and IPv6 with options and extension headers, ICMP and ICMPv6, TCP and UDP, DNS and mDNS records, DHCP, NTP, TLS handshake metadata such as SNI and ALPN, HTTP/1 request and response headers, STUN and QUIC long-header identification. The protocol support matrix lists exact fields and limits.
- Packet inspector and hex view Each frame opens in a decoded layer tree next to its raw hexadecimal bytes and ASCII column, with a key and value filter. Frames can carry comments, checksums can be validated, and findings link straight to the session and frame they cite.
- Investigation views Overview shows frames, sessions, traffic over time, protocol share, retransmissions and findings. Further views include a Flow Map, scoped search, ladder diagrams, TCP health charts, response times, Protocol Hierarchy, DNS Lookups with encrypted-DNS recognition and Message Counts.
- Flow Map The map groups destination addresses of a capture by the regional internet registry that administers each address block (ARIN, RIPE, APNIC, LACNIC, AFRINIC), drawn from a neutral This Mac anchor. The app states that the lines show reach and concentration, not server locations or network paths. An optional local MaxMind-format GeoIP database adds location context per Project.
- Follow Stream An explicit Follow Stream action rescans a stable saved or stopped capture to show a bounded TCP or UDP conversation with frame citations and visible gaps. It reads HTTP/1 exchanges, cleartext HTTP/2 and WebSocket messages and can save supported streams and HTTP response bodies.
- Findings Tracexy reports evidence-linked TCP, DNS, TLS and ICMP problems such as unanswered handshakes, flow-control issues and cleartext credentials. Incomplete evidence is marked as unknown. The README describes findings as selected local observations, not a complete security engine.
- Projects, tabs and History Projects keep separate investigations with their own workspaces, saved-capture Library, History, filters and capture and privacy settings, and support configuration-only import and export. Named workspace tabs inside a Project keep their own scope and panels. History stores capture and session summaries in a local SQLite database without packet payloads.
- Command line and MCP tool The app binary includes a read-only command line with
summary,sessionsandfindingscommands for History. A bundled read-only MCP stdio executable exposes four bounded History tools for one explicitly granted Project. Neither opens a network listener, controls capture or returns raw frames. - Local AI assistant The in-app assistant sends a reviewed, bounded brief of a selected session only to a validated local model endpoint. Remote and bring-your-own-key providers are not implemented in the Community source checkout.
- Protected session export The
.tracexysessionformat omits raw frames and sensitive decoded metadata according to the Project's Privacy settings, for sharing a reviewed investigation. The privacy and security guide describes the trust model. - Installation on macOS The notarized DMG for macOS 14 or later is downloaded from rockxy.io, with a published SHA-256 checksum, or installed with
brew install --cask tracexy. Building from source requires Xcode 16 and a personal signing configuration inConfiguration/Developer.xcconfig; updates of the official build use signed Sparkle update checks that never include captured traffic. - Pro license options Pro is one feature set sold as Personal (1 Mac, $18 founding price, $39 planned regular), Multi-Mac (2 Macs, $28 founding, $59 planned) and Lifetime (2 Macs, $299). Personal and Multi-Mac include 12 months of updates and support with optional renewals of $19 or $29 per year; the pricing page lists a 14-day refund window. Pro adds capture comparison, History search across captures, batch analysis, scheduled capture, custom finding rules, HTML and PDF reports, redaction profiles, an advanced I/O graph builder, a TLS key-log launcher and higher Project, tab and rule limits.
Where Tracexy fits
Tracing a failing request back to a Mac app
The website describes the main workflow as starting from the app rather than from packets: pick an interface, scope it with a BPF filter, then narrow live traffic by application, domain and IP address to the sessions behind a failure. The session inspector shows the correlated action timeline, decoded layers, payload and hex for the selected conversation, and session errors are counted in the status bar.
Analyzing saved PCAP and PCAPNG files
Captures from other machines or tools such as tcpdump open without the privileged helper. Tracexy folds the frames into sessions, computes the Overview charts and findings and keeps the original capture in the Project Library. Merge, split and selected-frame export prepare subsets of a capture, and the usage guide covers filtering, correlation and the inspectors.
Checking TCP, DNS and TLS behavior
TCP health charts, ladder diagrams and response times show handshake, retransmission and timing behavior of a conversation. DNS Lookups list queries and answers and mark encrypted DNS, while TLS sessions expose offered and chosen versions, cipher information, SNI and ALPN without decrypting application data. Findings point to unanswered handshakes, flow-control issues or cleartext credentials with a link to the cited frames.
Sharing evidence with a support or security team
A Project can be exported as a protected .tracexysession file that leaves out raw frames and sensitive metadata according to the Privacy settings, or as a raw PCAP or PCAPNG after explicit acknowledgement. With a Pro license, reports can be exported as HTML or PDF with reusable redaction profiles applied before handoff.
Querying capture history from scripts and AI assistants
The read-only command line built into the app prints History summaries, sessions and findings, and the bundled MCP stdio tool gives an MCP client read access to the same History data for one granted Project. Both run locally without a network listener. Comparable cross-platform traffic monitoring is offered by Sniffnet.
Install
brew install --cask tracexyReviews of Tracexy
Be the first to share your experience with Tracexy.
Write a review
Loading review form…